Graphically, economic growth is represented as
A) a movement along the production possibilities curve.
B) a movement from a point inside the production possibilities curve to a point on the curve itself.
C) an inward shift of the production possibilities curve.
D) an outward shift of the production possibilities curve.
Question 2
A model is used to explain economic behavior. Therefore
A) the assumptions must be complex while the model itself is simple.
B) the model must be complex.
C) the model must be simple.
D) the model can be either simple or complex so long as it explains economic behavior.

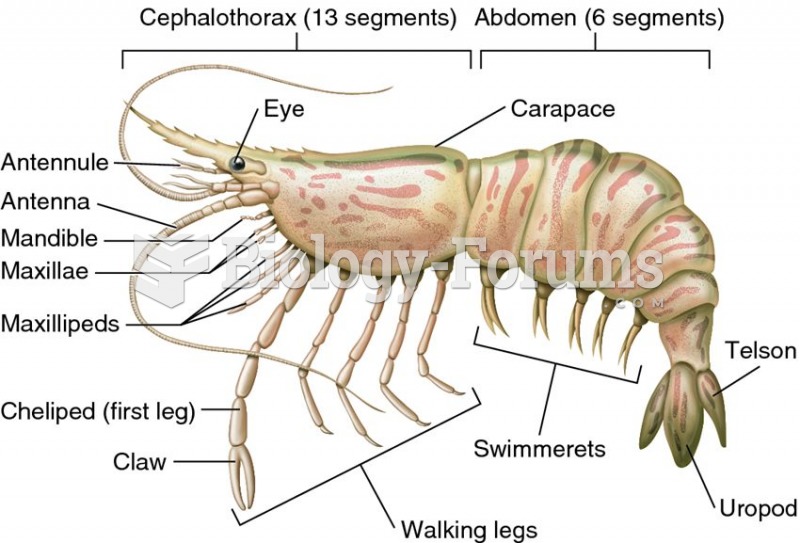 Body plan of a crustacean, as represented by a shrimp
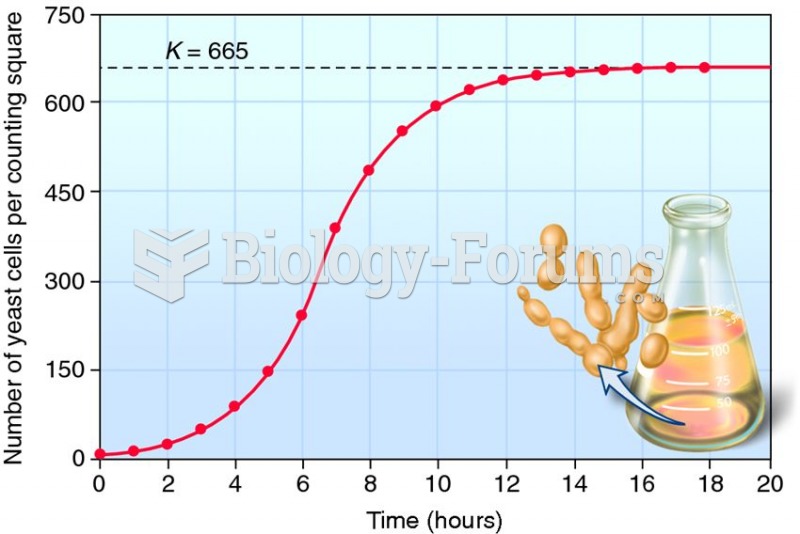 Growth of yeast cells in culture fits the logistic growth model.
 The transition from college to first job can be a triggering situation for new growth in meaning ...
 Rock the leg to create movement at the hip joint. Apply passive movements to mobilize knee and hip ...
 economic question
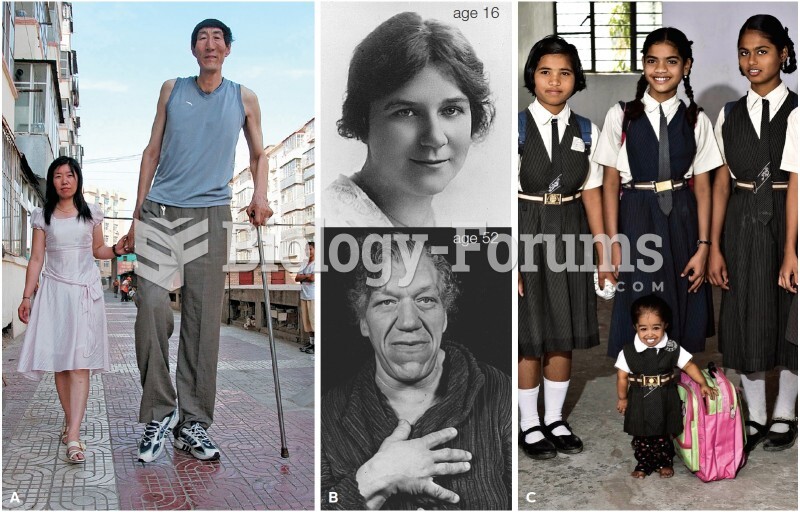 Effects of disrupted growth hormone function