This topic contains a solution. Click here to go to the answer
|
|
|

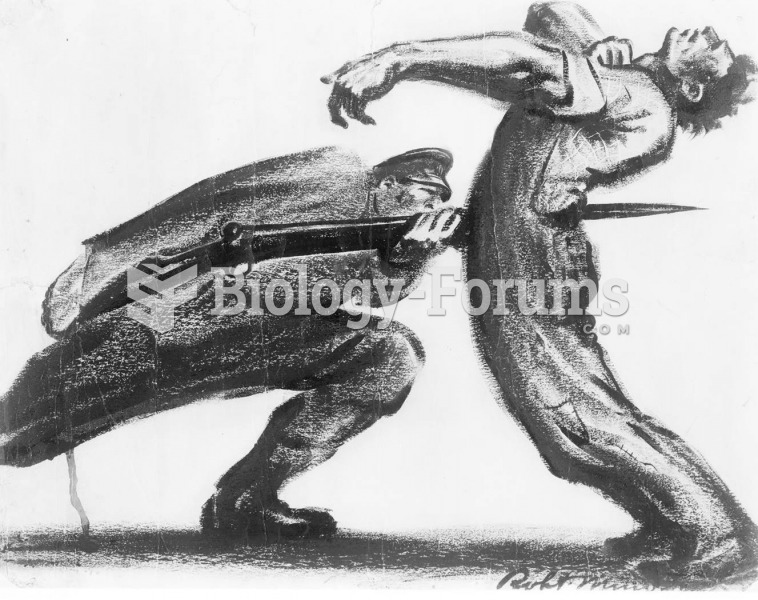 The Masses, a leading Socialist magazine, featured drawings by artists, including John Sloan, as wel
 Continuum of aggression. Based on an unpublished figure by Joanne DeSanto Iennaco.
 How to graph complex numbers
 How to graph line equations without a table of values
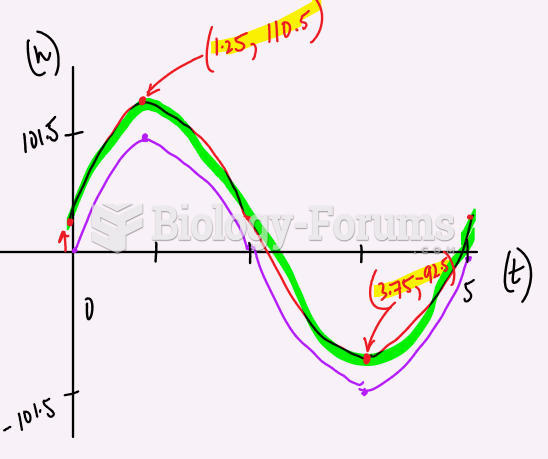 Graph
Graph
 Use the graph of the function f(x) to answer each question.