This topic contains a solution. Click here to go to the answer
|
|
|

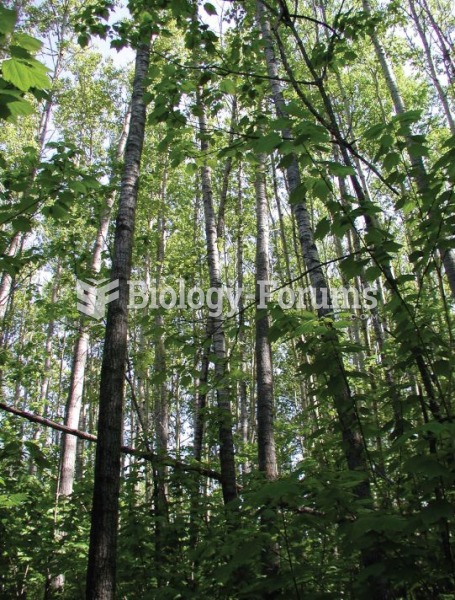 Changes in boreal forest composition along a chronosequence in Quebec. Dates refer to the year of th
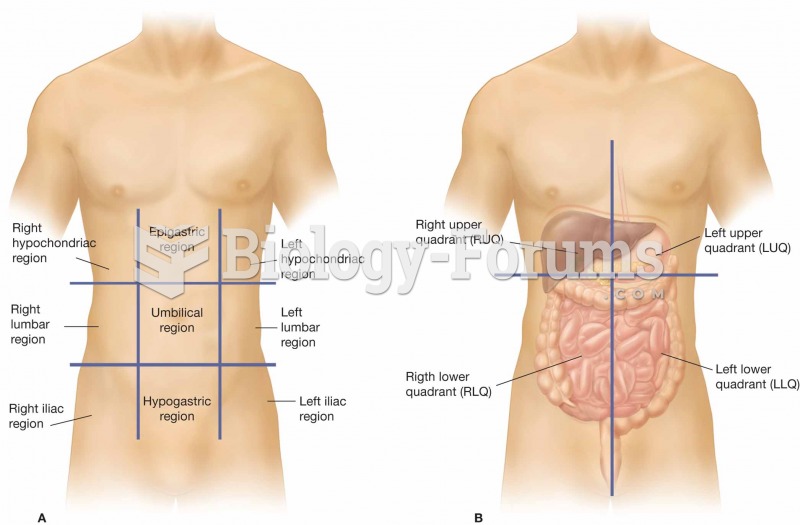 (A) The nine regions of the abdominopelvic cavity. (B) The four regions of the abdomen, which are re
 Demonstrate the Application of Triangular, Figure-Eight, and Tubular Bandages
 Demonstrate the Application of Triangular, Figure-Eight, and Tubular Bandages
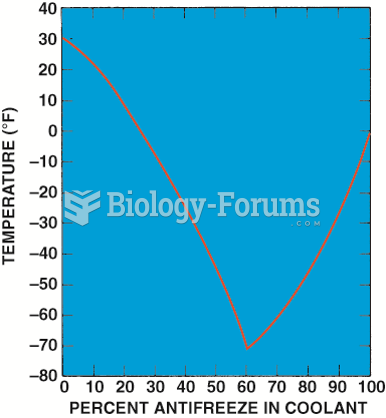 Graph showing the relationship between the freezing point of the coolant and the percentage of ...
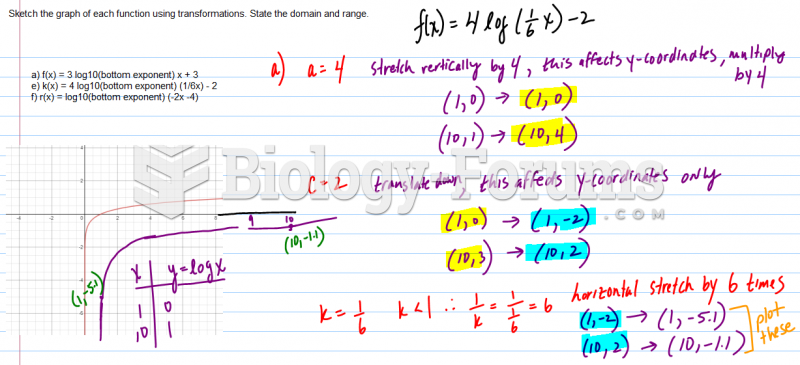 Sketch the graph of each function using transformations. State the domain and range.