This topic contains a solution. Click here to go to the answer
|
|
|

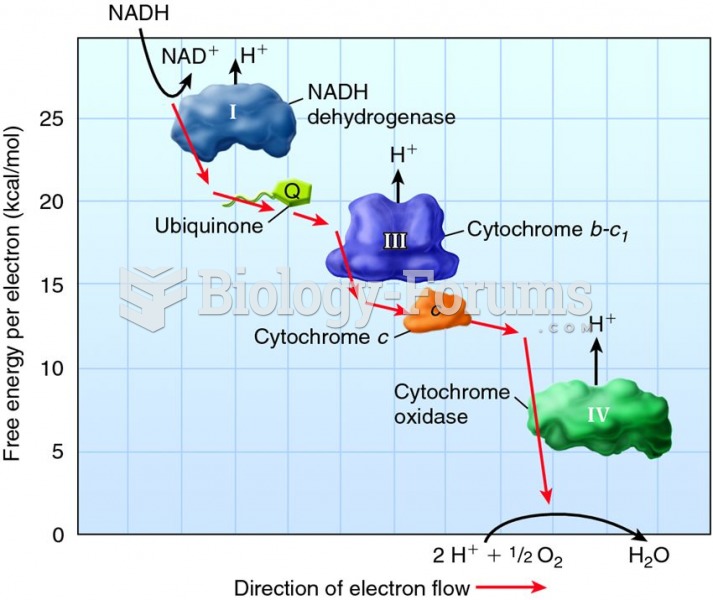 The relationship between free energy and electron movement along the electron transport chain
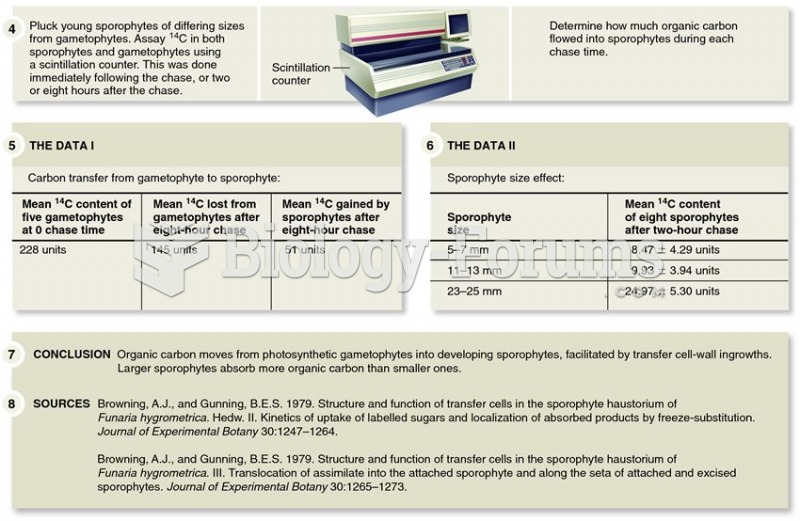 Browning and Gunning demonstrated that placental transfer tissues increase plant reproductive succes
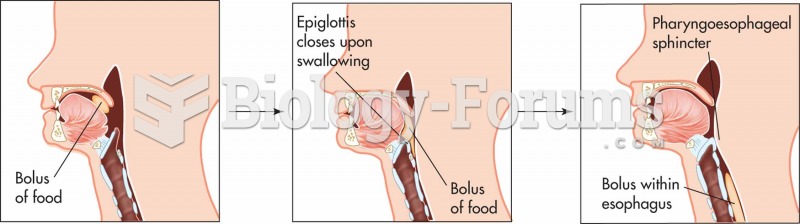 Movement of a bolus of food from the mouth to the esophagus. The bolus then travels to the stomach.
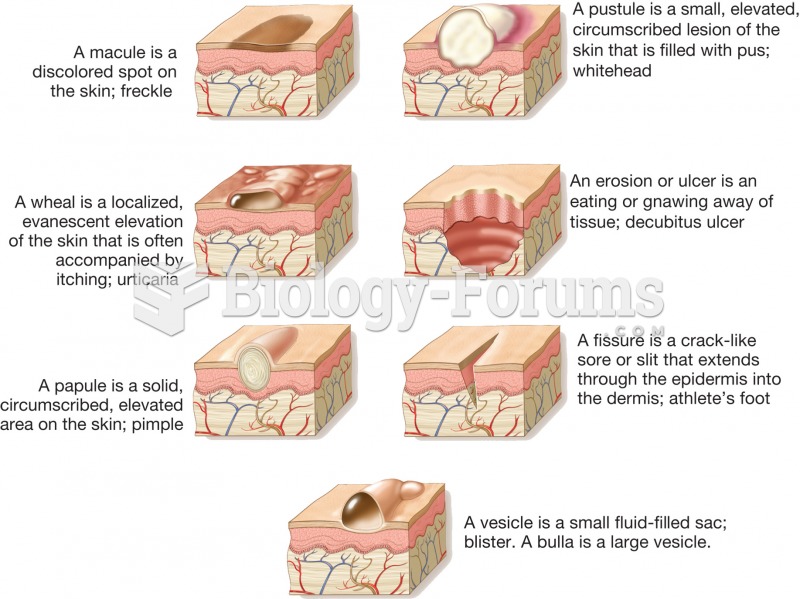 Common skin signs. Each of the illustrations depicts a section through skin
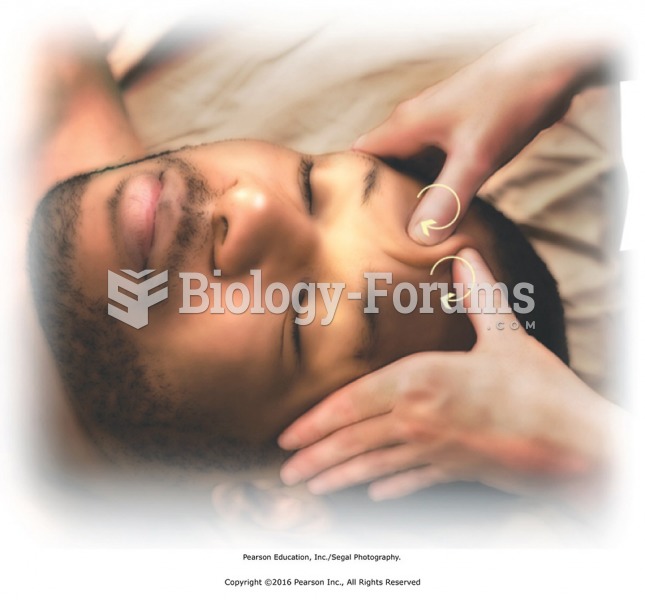 Circular petrissage to forehead. Use the thumbs moving in counterclockwise circles. The movement is ...
 Bayesian Analysis of the Genotype of II-2 in Figure A.4