This topic contains a solution. Click here to go to the answer
|
|
|

 Analogy for How Magnetic Field Strengths Increase
 Scissoring motion to create movement between the metacarpals of the hand.
 Molecular Movement
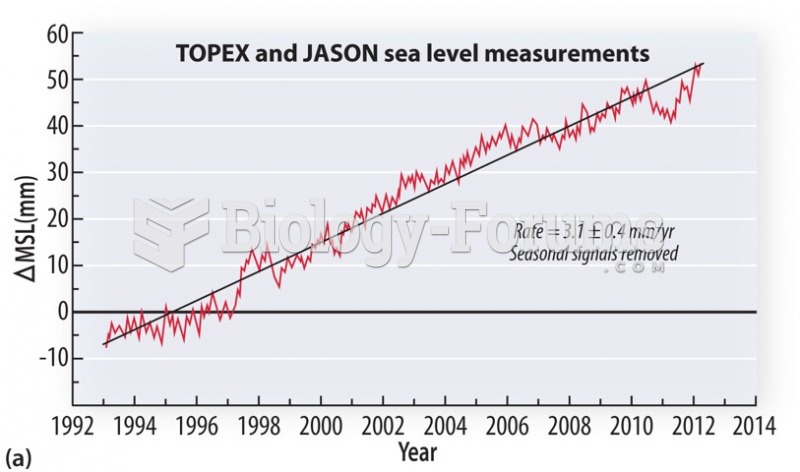 Increase in rainfall on continents
 Effect of an Increase in gA,2 on Productivity and Output
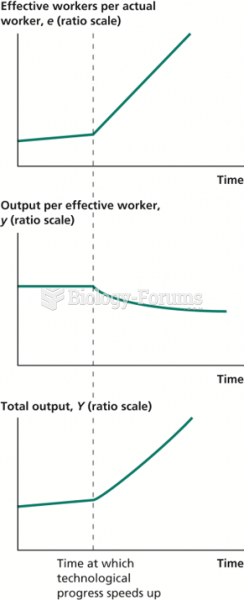 Effect of an Increase in Technological Progress