|
|
|

 How to create a frequency table and histogram from raw data
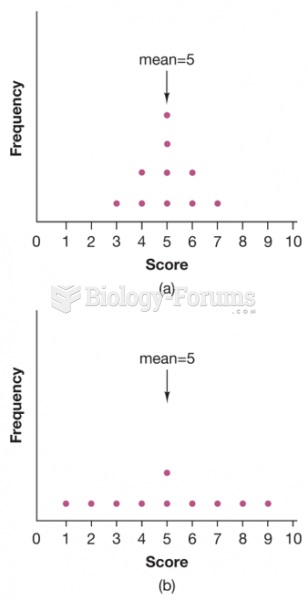 . In which distribution is the mean more “typical” of all scores?
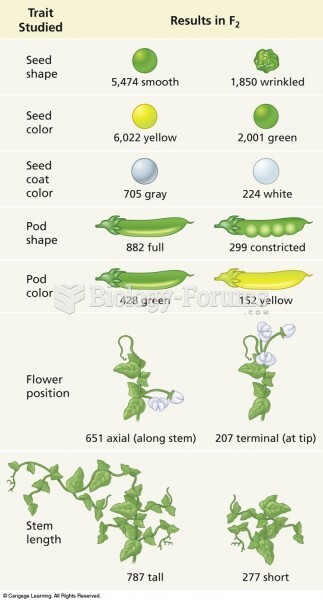 Results of Mendel’s crosses using pea plants. The numbers represent the F2 plants showing a given ...
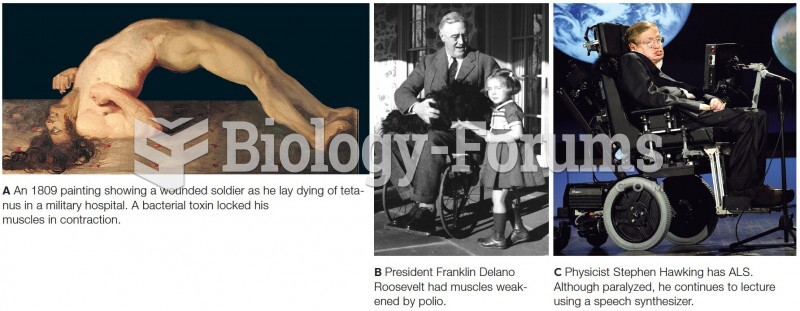 Results of disrupted control of skeletal muscles
 The consequences of the intensity of natural selection on allele frequency.
 Cytological proof from Zea mays that recombination results from crossing over