This topic contains a solution. Click here to go to the answer
|
|
|

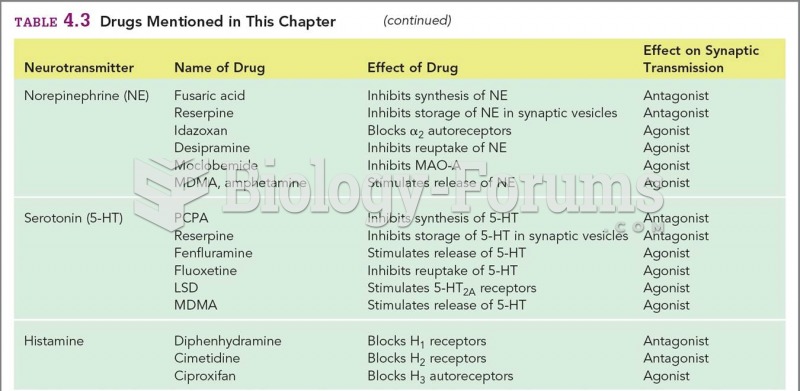 Drugs and their effect table
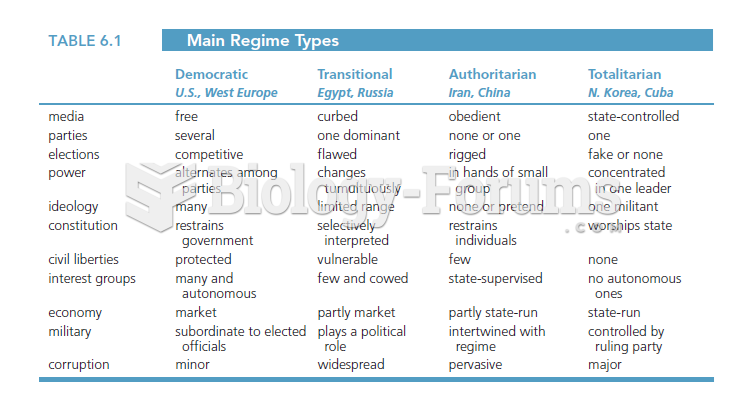 Table 6.1 illustrates the main regime types and their differences. It breaks the regimes into four
 Determining a good table height. Stand facing the table with your hands at your sides. Adjust the ...
 Layers of sheets and towels on the table for a body wrap.
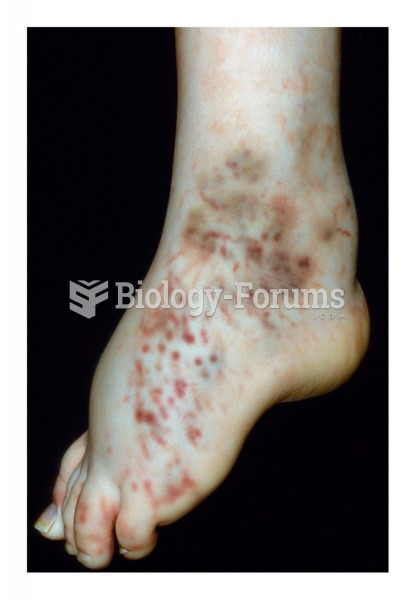 Grouped lesions
 table
table