Author Question: Suppose the governor of California has proposed increasing toll rates on California's toll roads, ... (Read 162 times)

james

  • Hero Member
  • *****
  • Posts: 573
Suppose the governor of California has proposed increasing toll rates on California's toll roads, and has presented two possible scenarios to implement these increases.
 
  Following are projected data for the two scenarios for the California toll roads:
 
  Scenario 1: Toll rate in 2015: 10.00. Toll rate in 2019: 22.50
  For every 100 cars using the toll roads in 2015, only 81.6 cars will use the toll roads in 2019.
 
  Scenario 2: Toll rate in 2015: 10.00. Toll rate in 2019: 17.50
  For every 100 cars using the toll roads in 2015, only 96.2 cars will use the toll roads in 2019.
 
  a. Using the midpoint formula, calculate the price elasticity of demand for Scenario 1 and Scenario 2.
  b. Assume 10,000 cars use California toll roads every day in 2015. What would be the daily total revenue received for each scenario in 2015 and in 2019?
  c. Is demand under Scenario 1 and under Scenario 2 price elastic, inelastic, or unit elastic. Briefly explain.
  (For above questions, assume that nothing other than the toll change occurs during the time frame listed that would affect consumer demand.)

Question 2

In facilitating the transition from a centrally planned to a market-oriented economy, explain the difference between the shock therapy versus gradualism approach.
 
  What will be an ideal response?


meow1234

  • Sr. Member
  • ****
  • Posts: 333
Answer to Question 1

a.
For Scenario 1:
Percentage change in quantity demanded = (81.6 - 100 ) / 90.8  100 = -20.3
Percentage change in price = (22.50 - 10.00 ) / 16.25  100 = 76.9
Price elasticity of demand = -20.3 / 76.9 = -0.26.

For Scenario 2:
Percentage change in quantity demanded = (96.2 - 100 ) / 98.1  100 = -3.9
Percentage change in price = (17.50 - 10.00 ) / 13.75  100 = 54.5
Price elasticity of demand = -3.9 / 54.5 = -0.07.

b. The daily total revenue in 2015 under both scenarios is (10,000 cars  10.00 ) = 100,000.
The daily total revenue in 2019 under Scenario 1 is (8,160 cars  22.50 ) = 183,600.
The daily total revenue in 2019 under Scenario 2 is (9,620 cars  17.

Answer to Question 2

The proponents of the shock therapy approach argue that the transition should be aggressive, quick, direct, and simultaneously impact all economic variables. In contrast, the gradualism approach recommends moderate and sequential changes over time starting with the development of market institutions, the gradual decontrol of prices, and the limited privatization of only the most cost efficient state-owned and operated businesses.
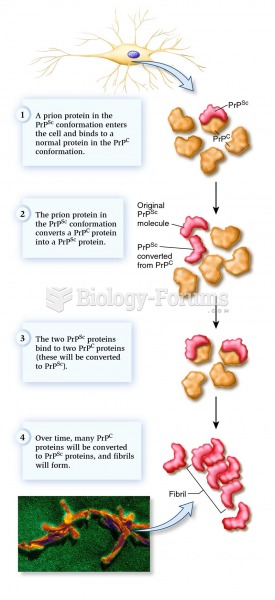


Related Topics

Need homework help now?

Ask unlimited questions for free

Ask a Question
 

Did you know?

In 1844, Charles Goodyear obtained the first patent for a rubber condom.

Did you know?

The U.S. Pharmacopeia Medication Errors Reporting Program states that approximately 50% of all medication errors involve insulin.

Did you know?

Although puberty usually occurs in the early teenage years, the world's youngest parents were two Chinese children who had their first baby when they were 8 and 9 years of age.

Did you know?

The top five reasons that children stay home from school are as follows: colds, stomach flu (gastroenteritis), ear infection (otitis media), pink eye (conjunctivitis), and sore throat.

Did you know?

The average older adult in the United States takes five prescription drugs per day. Half of these drugs contain a sedative. Alcohol should therefore be avoided by most senior citizens because of the dangerous interactions between alcohol and sedatives.

For a complete list of videos, visit our video library