Answer to Question 1
a.
For Scenario 1:
Percentage change in quantity demanded = (81.6 - 100 ) / 90.8 100 = -20.3
Percentage change in price = (22.50 - 10.00 ) / 16.25 100 = 76.9
Price elasticity of demand = -20.3 / 76.9 = -0.26.
For Scenario 2:
Percentage change in quantity demanded = (96.2 - 100 ) / 98.1 100 = -3.9
Percentage change in price = (17.50 - 10.00 ) / 13.75 100 = 54.5
Price elasticity of demand = -3.9 / 54.5 = -0.07.
b. The daily total revenue in 2015 under both scenarios is (10,000 cars 10.00 ) = 100,000.
The daily total revenue in 2019 under Scenario 1 is (8,160 cars 22.50 ) = 183,600.
The daily total revenue in 2019 under Scenario 2 is (9,620 cars 17.
Answer to Question 2
The proponents of the shock therapy approach argue that the transition should be aggressive, quick, direct, and simultaneously impact all economic variables. In contrast, the gradualism approach recommends moderate and sequential changes over time starting with the development of market institutions, the gradual decontrol of prices, and the limited privatization of only the most cost efficient state-owned and operated businesses.

 California Red-Sided Garter Snake
 JFK and Jacqueline Kennedy ride in a motorcade with Texas Governor John Connolly and his wife in ...
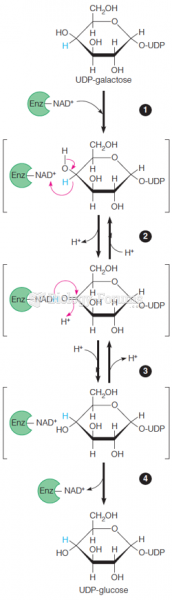 Proposed mechanism for UDP-galactose epimerase
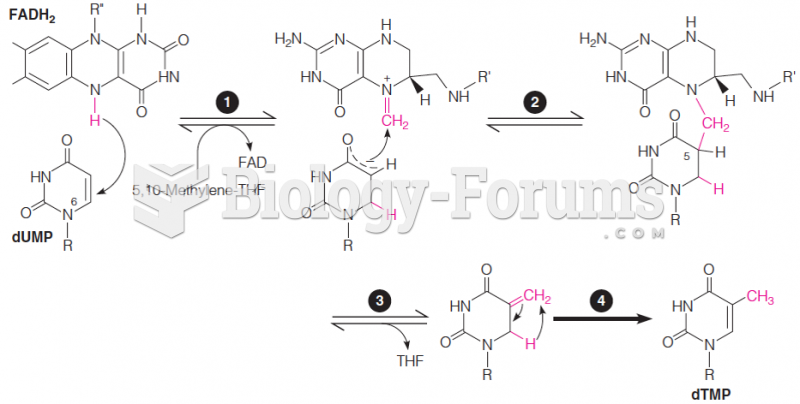 Proposed mechanism for the reaction catalyzed by flavin-dependent thymidylate synthase
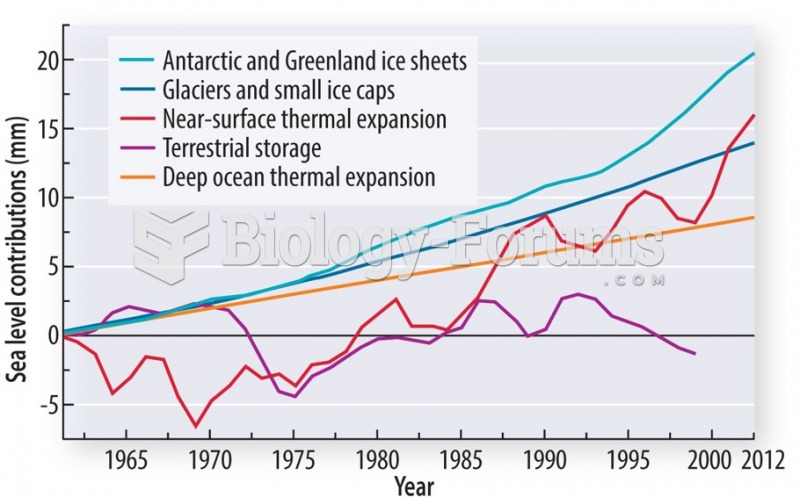 The melting of glaciers and ice sheets is making an increasing contribution
 Florometra Crinoid or Feather Star, Phylum Echinodermata. Monterey Canyon, California.