|
|
|

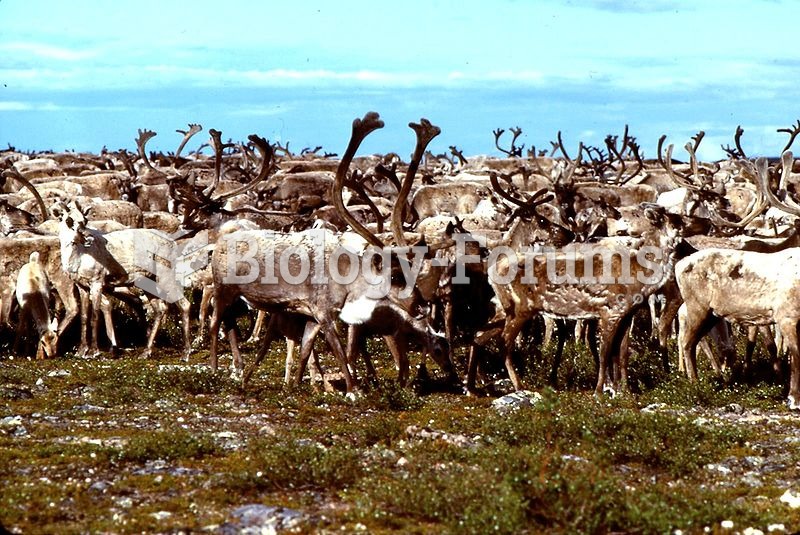 A herd of barren-ground caribou at the Thelon River. This subspecies is a long-distance migrant
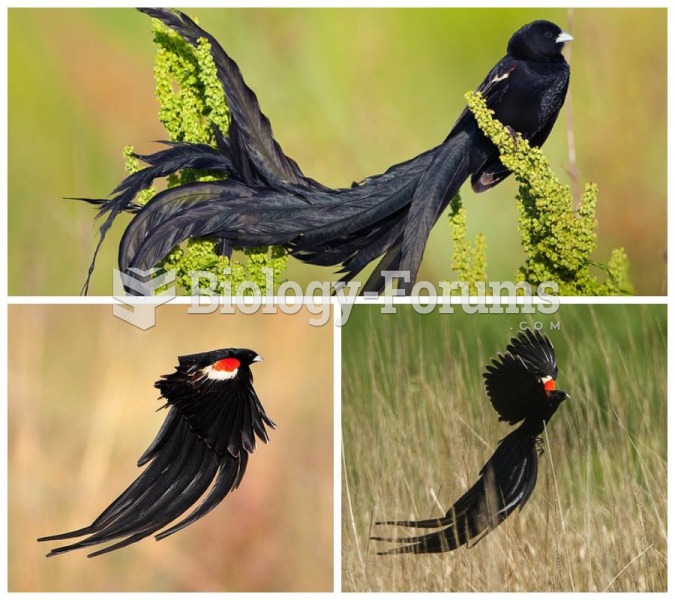 Long-tailed Widowbird
 The gray scale.
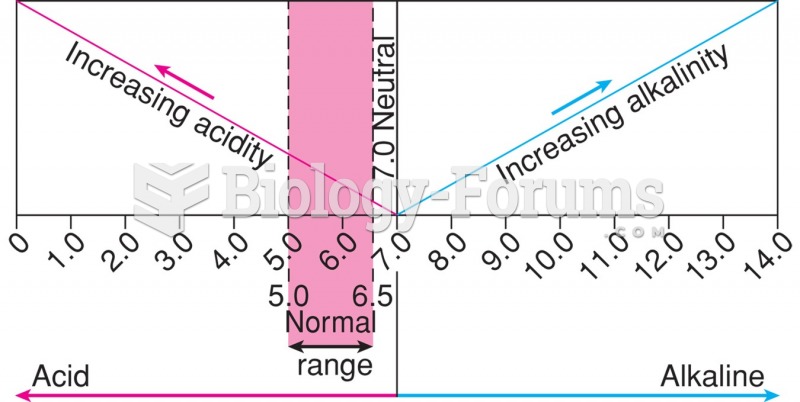 Urine pH scale.
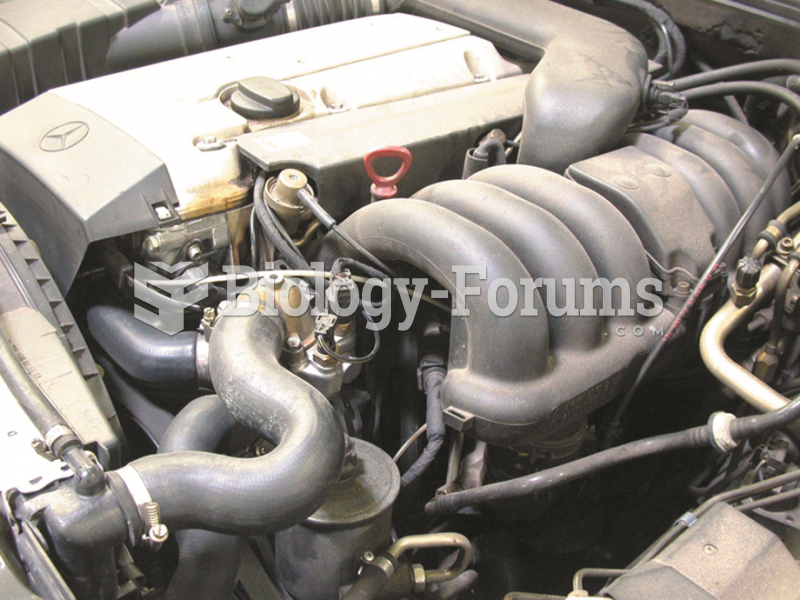 A port fuel-injected engine that is equipped with long, tuned intake-manifold runners.
 How to find the average value of a function (Part 2)