|
|
|

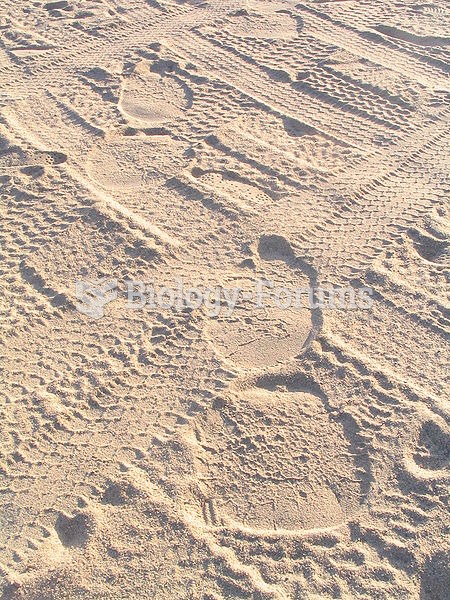 Elephant footprints (tire tracks for scale)
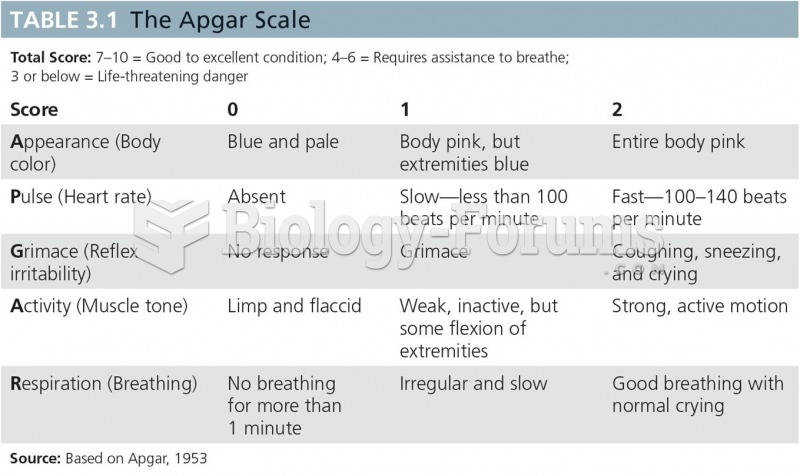 The Apgar Scale
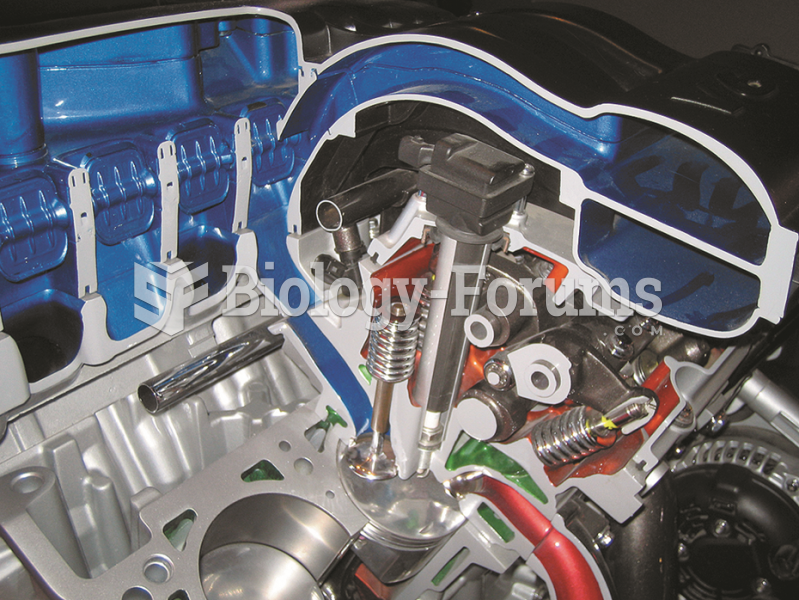 The air flowing into the engine can be directed through long or short runners for best performance ...
 Mobilize joints of the feet and ankle. Apply scissoring to metatarsals and figure-8s to toes. Dorsi- ...
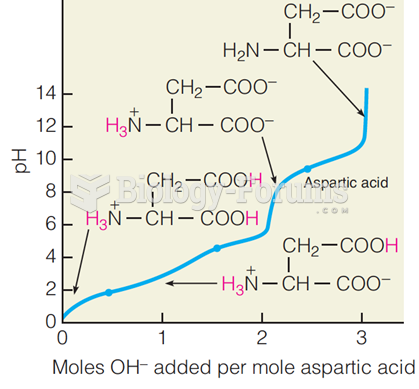 Titration curve for aspartic acid
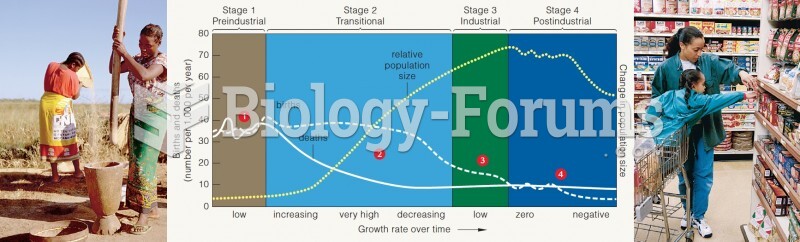 Demographic transition model for changes in population growth rates and sizes, correlated with long-