|
|
|

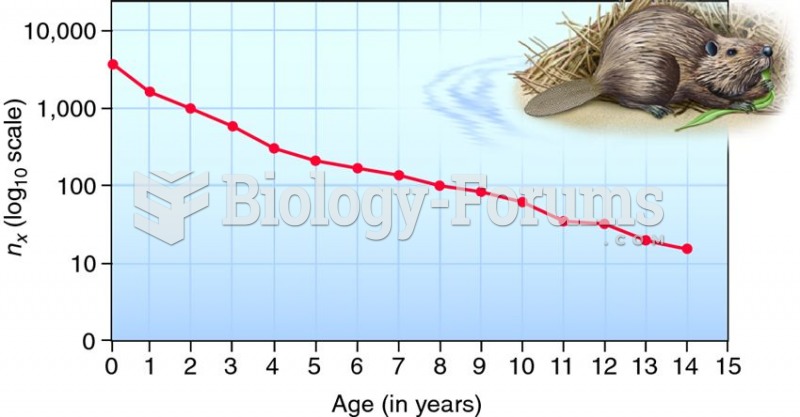 Survivorship curve for the North American beaver.
 Decimal Point Place Values
 Joint movement of the fingers. Apply scissoring at the knuckles and figure-8s to the fingers to ...
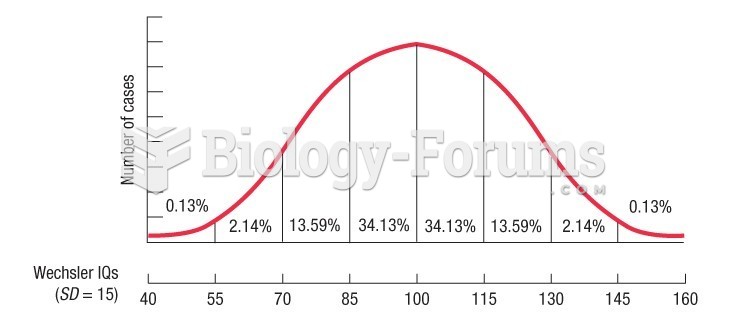 IQ scores form what mathematicians call a normal distribution "bell curve"
 As shown in the figure, a large open tank contains a layer of oil ( density 450 kg/m3) floating ...
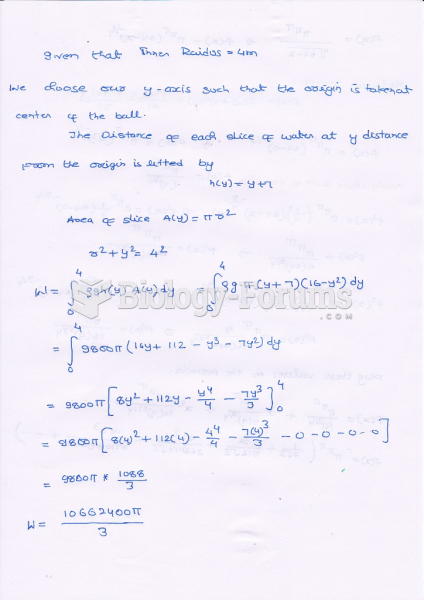 A spherical water tank with an inner radius of 4 m has its lowest point 3 m ...