|
|
|

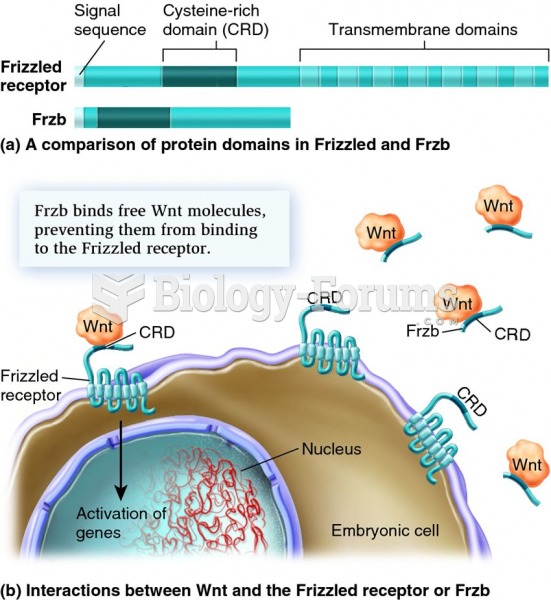 The actions of Frzb and the Frizzled receptor protein show how embryonic development represents a ba
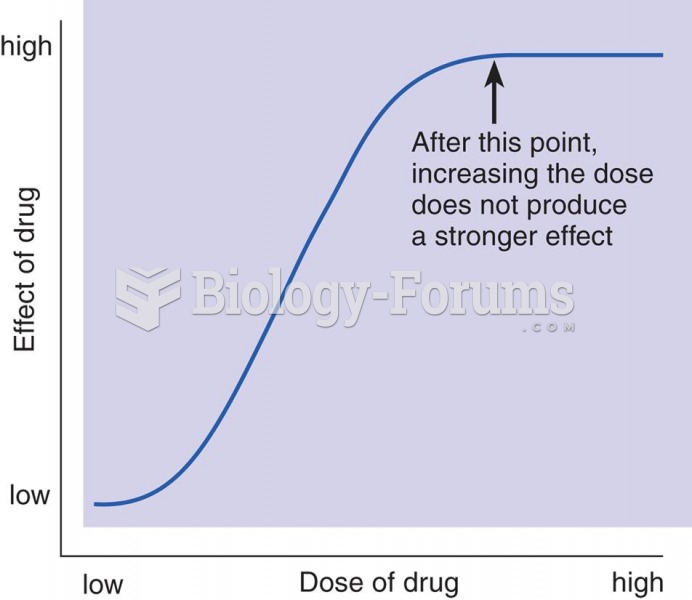 A Dose-Response Curve
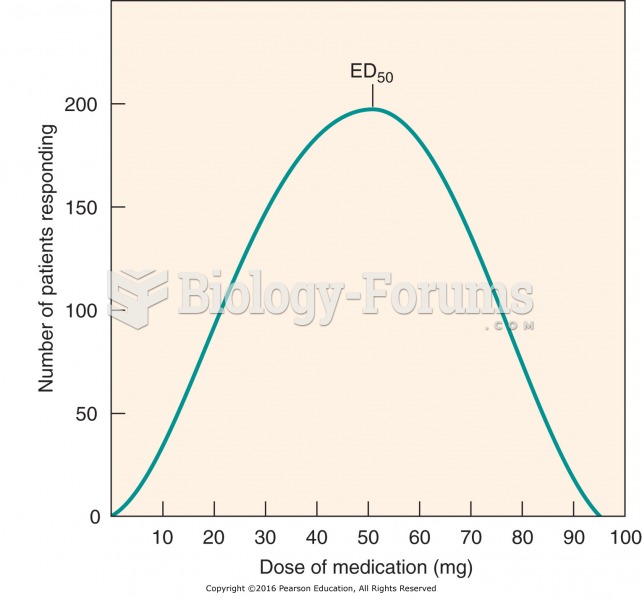 Frequency distribution curve: interpatient variability in drug response.
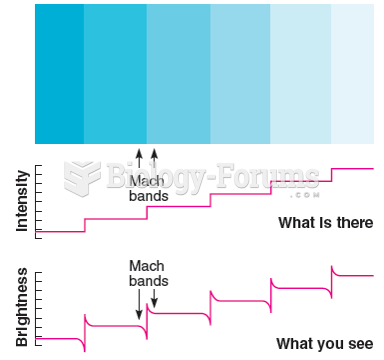 The illusory bands visible in this figure are often called Mach bands, although Mach used a ...
 How to create a sine equation when the curve is given
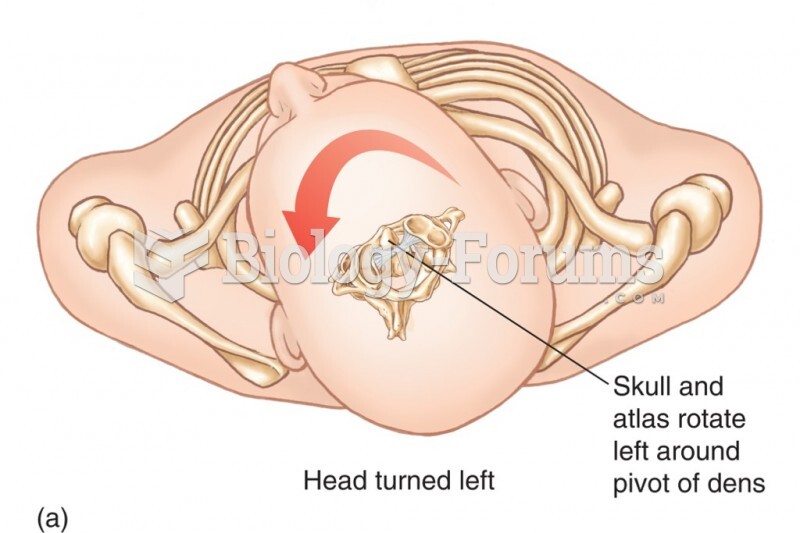 Relationship Between the Atlas and the Axis. The Dens of the Axis Provides a Pivotal Point Around Wh