In the figure above, the curve that shows the diminishing marginal utility is
A) total utility curve A because it gets steeper as consumption of tomatoes increases.
B) total utility curve A because it is higher than total utility curves B or C.
C) total utility curve C because it gets flatter as consumption of tomatoes increases.
D) total utility curve C because it is lower than total utility curves B and C.
Question 2
In the figure above, the marginal cost of producing a computer
A) increases as more computers are produced.
B) stays the same as more computers are produced.
C) decreases as more computers are produced.
D) is the same as the marginal cost of producing a television set.

 A Total Eclipse of the Sun
 Localization of a Peptide The peptide is revealed by means of immunocytochemistry. The photomicrogra
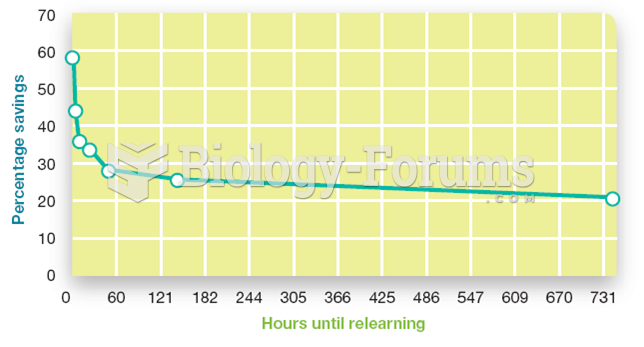 Ebbinghaus’s forgetting curve
 This label on a Toyota Camry hybrid shows the relative smog-producing emissions, but this does not ...
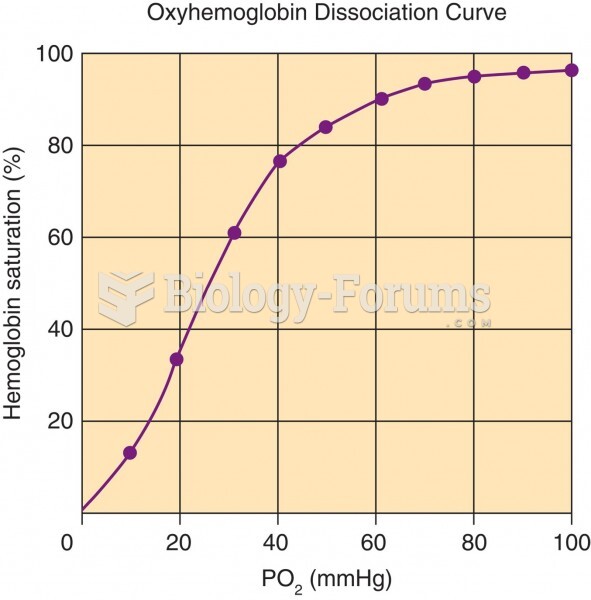 The Oxyhemoglobin Dissociation Curve
 The age-of-onset curve for Huntington disease (HD)