In the figure above, the curve that shows the diminishing marginal utility is
A) total utility curve A because it gets steeper as consumption of tomatoes increases.
B) total utility curve A because it is higher than total utility curves B or C.
C) total utility curve C because it gets flatter as consumption of tomatoes increases.
D) total utility curve C because it is lower than total utility curves B and C.
Question 2
In the figure above, the marginal cost of producing a computer
A) increases as more computers are produced.
B) stays the same as more computers are produced.
C) decreases as more computers are produced.
D) is the same as the marginal cost of producing a television set.

 Reconstructed Australopithecus afarensis spine shows that species walked upright.
 Effects of Therapy for Stuttering A functional MRI scan shows regions of the superior temporal lobe
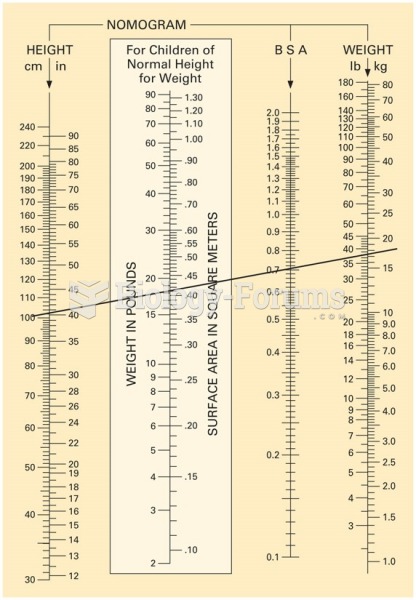 Nomogram chart. This example shows a line drawn from a child’s height of 100 cm to his weight, 35 ...
 How to create a sine equation when the curve is given
 How to find the equation of a cosine curve
 At what speed does Grogzetti need to take the curve to avoid sliding?