This topic contains a solution. Click here to go to the answer
|
|
|

 Blood pressure and blood volume relationship
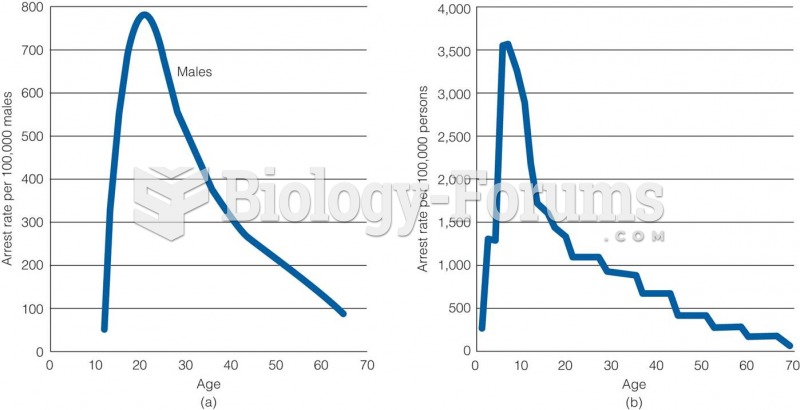 Age-Crime Relationship in (a) 1842 and (b) 1992
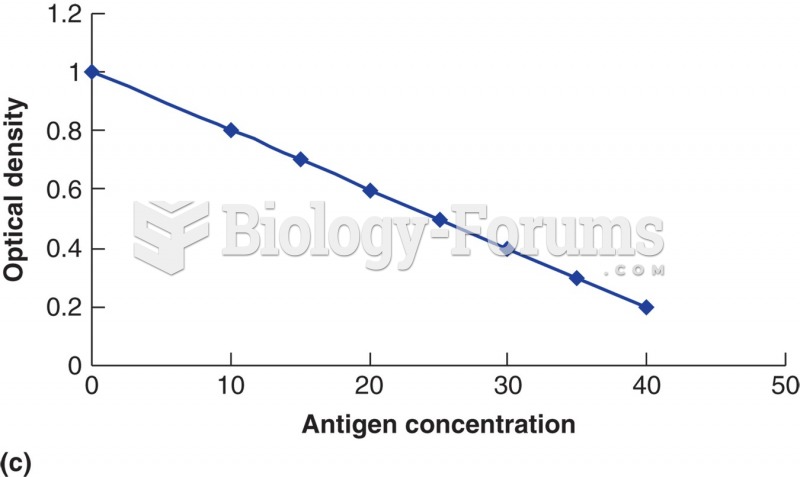 The relationship of substrate con- version (as measured by optical density) to the amount of patient ...
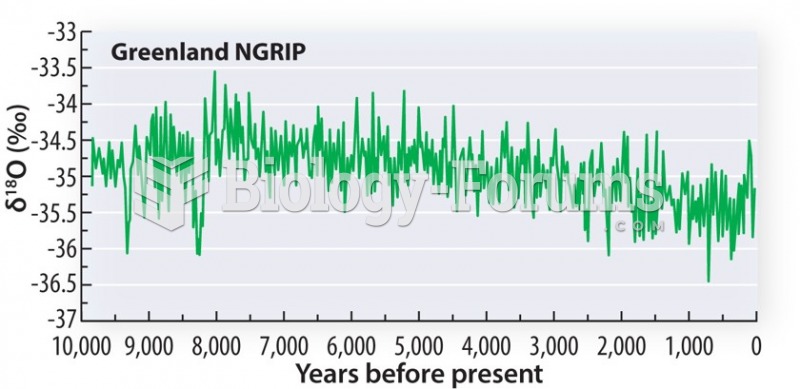 Early 20th century warming
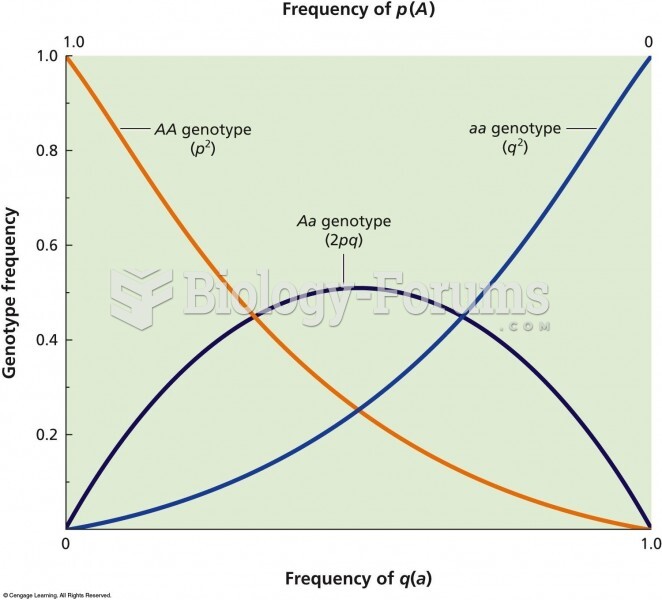 The relationship between allelic frequency and genotypic frequency in a population that is in Hardy-
 Early growth of corn (Zea mays), a typical monocot.