|
|
|

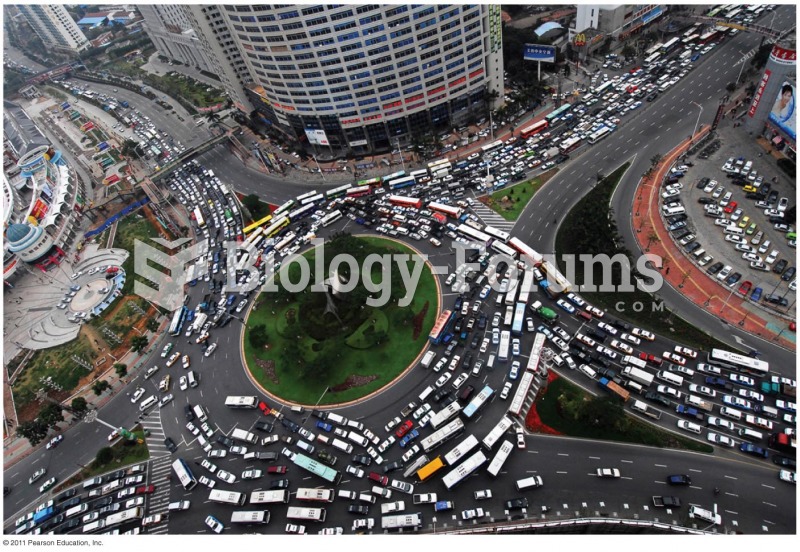 An Oil-dependent World— Supply and Demand Driven
 The Kingsley plantation, on Fort George Island in Jacksonville, Florida. Zephaniah Kingsley, the own
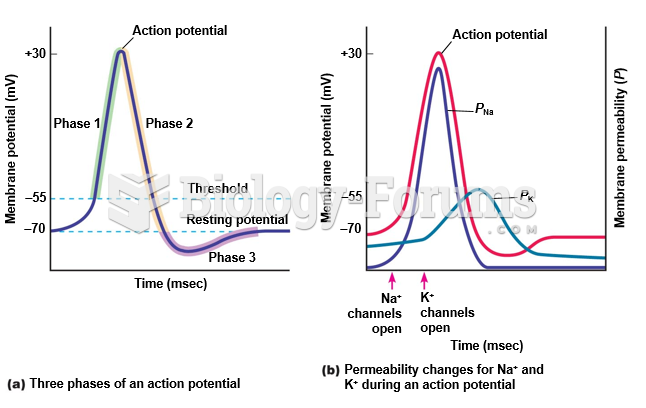 The phases and ionic basis of an action potential.
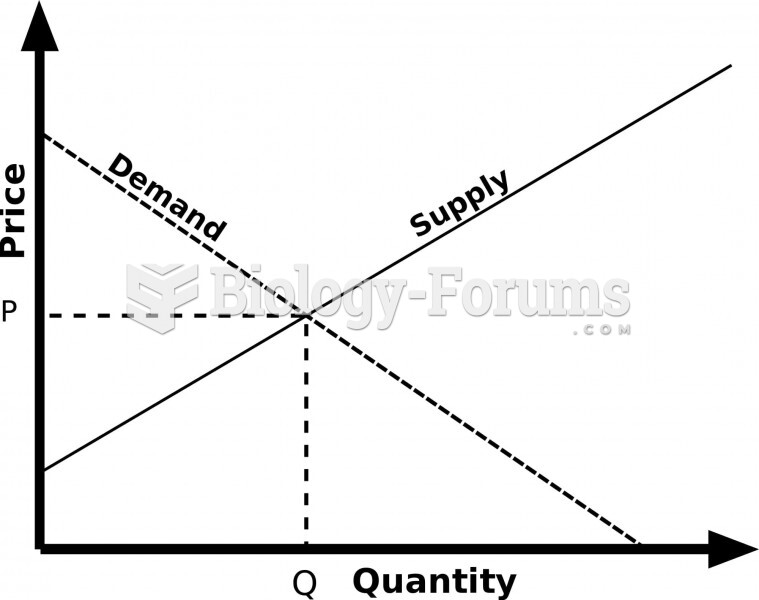 The original Supply and Demand graph
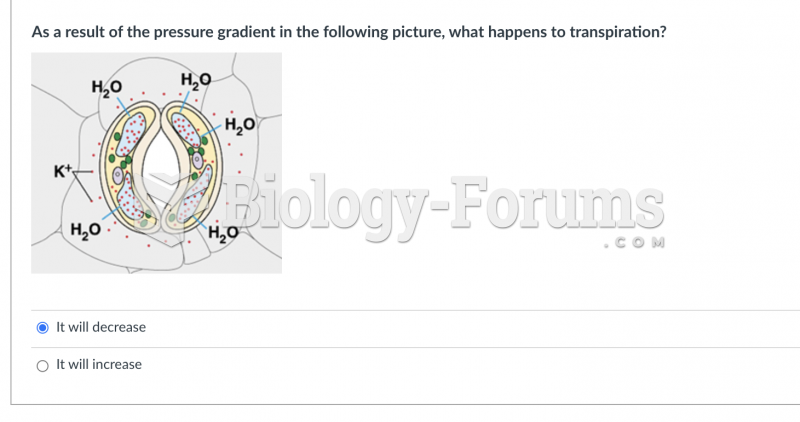 As a result of the pressure gradient in the following picture, what happens to transpiration?
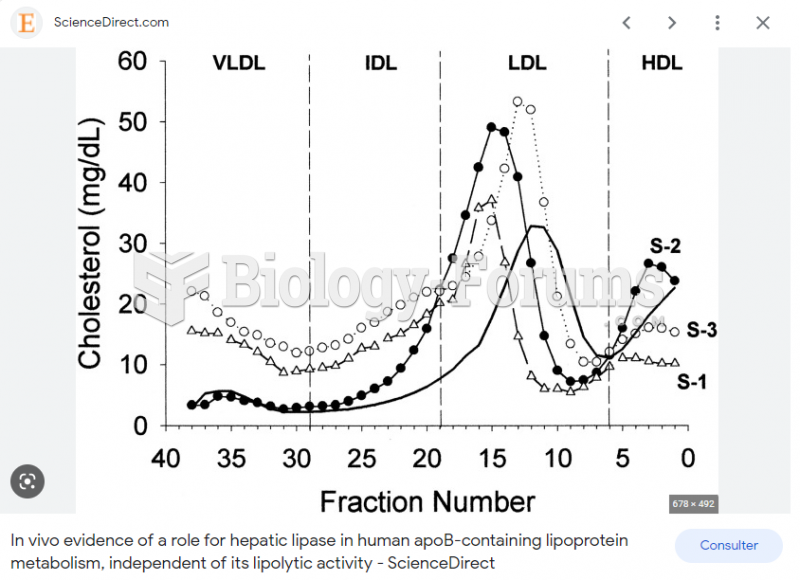 result of DGUC