|
|
|

 The Real Reason Why They Repeat the Same 20 Songs on the Radio & TV Nationwide
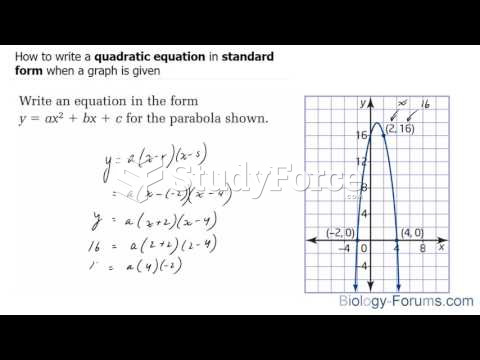 How to write a quadratic equation in standard form when a graph is given
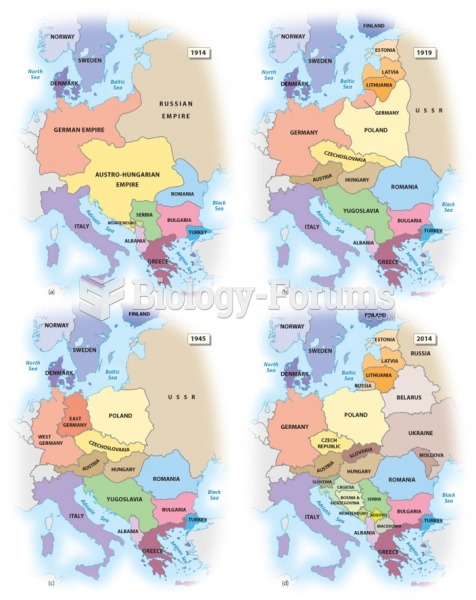 Geopolitical Change of 20th-Century Europe
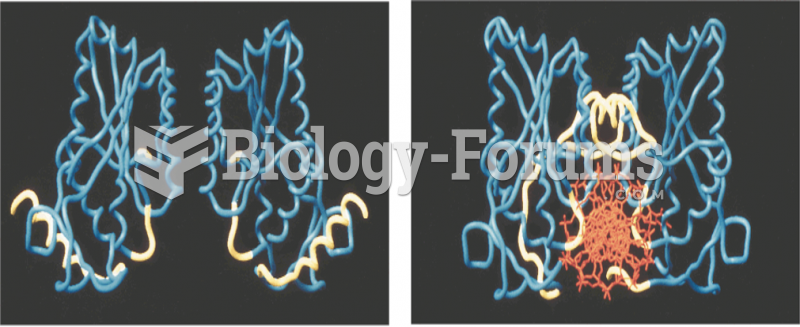 Structures of (a) free and (b) DNA-bound forms of BamHI, with DNA shown end-on, in orange
 The sequence of steps during delivery is shown clearly in these drawings
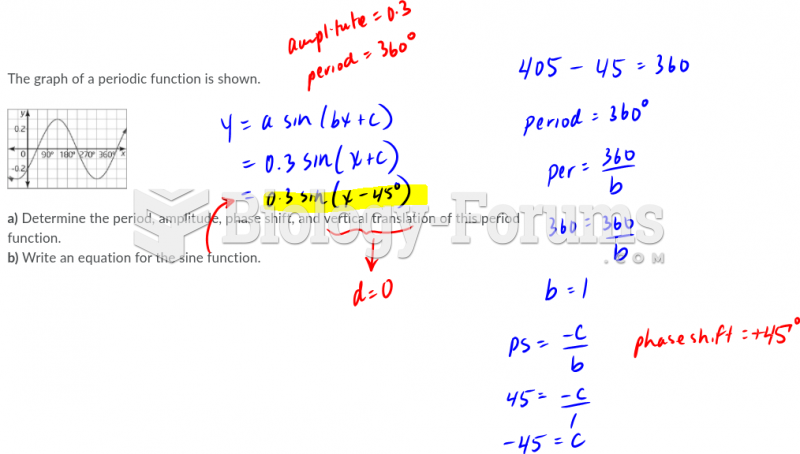 Look at the graph function shown belowPlea