Did you know?
Tobacco depletes the body of vitamins A, C, and E, which can result in any of the following: dry hair, dry skin, dry eyes, poor growth, night blindness, abscesses, insomnia, fatigue, reproductive system problems, sinusitis, pneumonia, frequent respiratory problems, skin disorders, weight loss, rickets, osteomalacia, nervousness, muscle spasms, leg cramps, extremity numbness, bone malformations, decayed teeth, difficulty in walking, irritability, restlessness, profuse sweating, increased uric acid (gout), joint damage, damaged red blood cells, destruction of nerves, infertility, miscarriage, and many types of cancer.
Did you know?
Many supplement containers do not even contain what their labels say. There are many documented reports of products containing much less, or more, that what is listed on their labels. They may also contain undisclosed prescription drugs and even contaminants.
Did you know?
Street names for barbiturates include reds, red devils, yellow jackets, blue heavens, Christmas trees, and rainbows. They are commonly referred to as downers.
Did you know?
Malaria mortality rates are falling. Increased malaria prevention and control measures have greatly improved these rates. Since 2000, malaria mortality rates have fallen globally by 60% among all age groups, and by 65% among children under age 5.

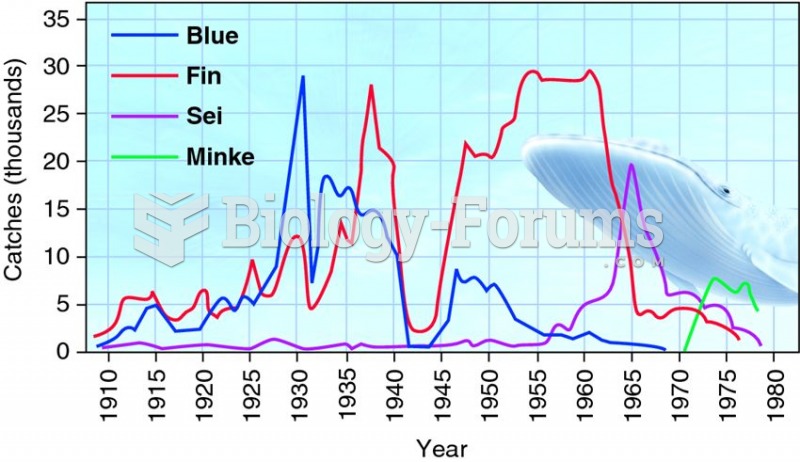 Sequential decline of whale catches in the Antarctic shows the strong effect of human predators.
 Thorndike’s Puzzle Box and the Law of Effect (1 of 2)
 Will the sun rise tomorrow? Are you sure? “Cause and effect” vs. sense experience.
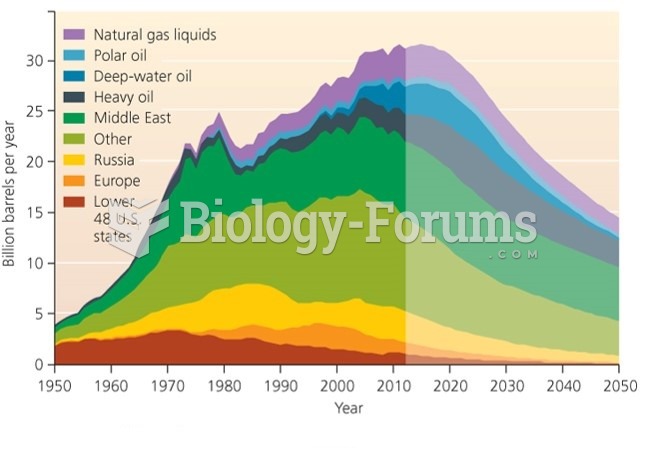 Modern Predication of Peak in Global Oil Production
 Vitamin C contributes to healthy, glowing skin by facilitating the production of collagen
 Role of Factors of Production in Determining Output per Worker, 2009