|
|
|

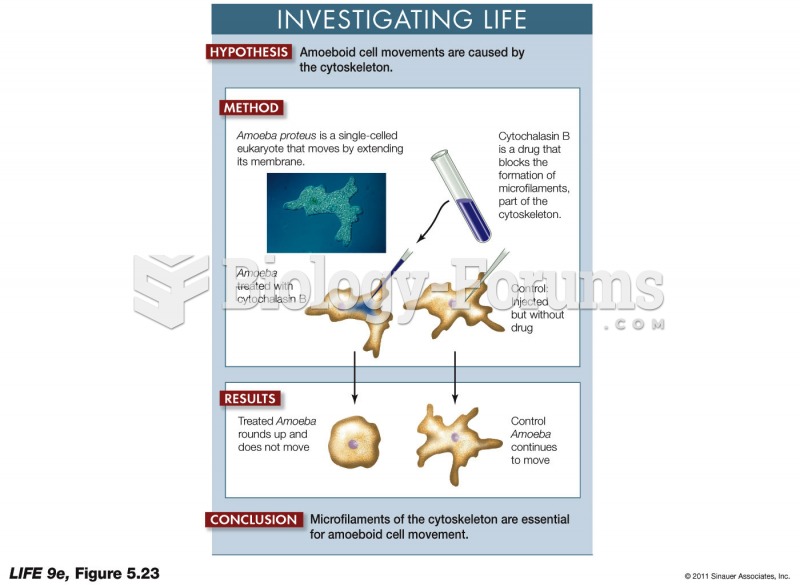 The Role of Microfilaments in Cell Movement-Showing Cause and Effect in Biology
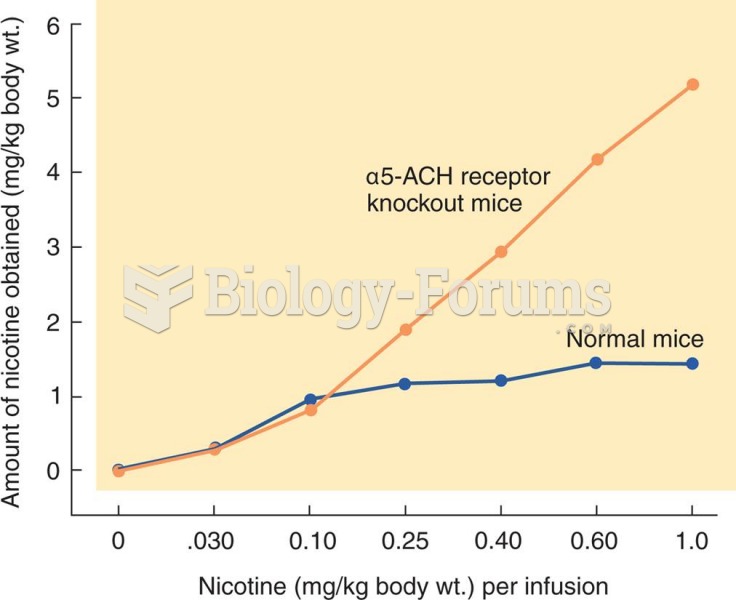 Effect of Knockout of the α5 Ach Receptor Gene in Mice
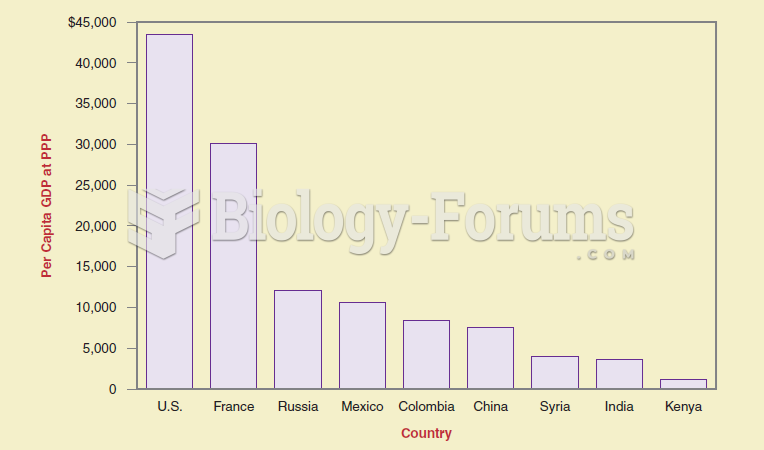 If you want to show differences between items at the same time, a bar graph is more effective than a
 Products like Beano contain enzymes that help reduce the production of gas in the large intestine
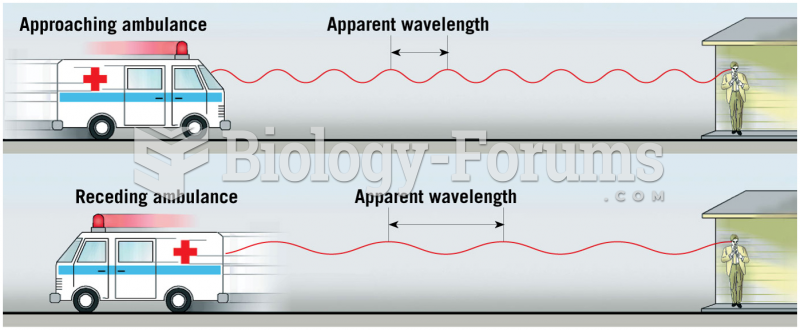 The Doppler Effect
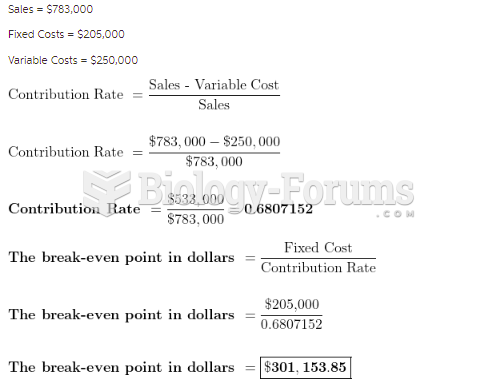 A company that makes environmental measuring devices has calculated their revenue and costs as ...