Figure 9.1 shows three aggregate demand curves. A movement from point b to point c could be caused by a(n)
A) decrease in government spending. B) decrease in the price level.
C) decrease in taxes. D) increase in the money supply.
Question 2
In the above figure, starting at E1, if there is a supply shock that is temporary, the
A) aggregate supply would shift to SRAS1 and LRAS0 would shift to LRAS1.
B) aggregate supply would shift to SRAS2 and LRAS0 would shift to LRAS1.
C) aggregate supply would shift to SRAS1 and then return to SRAS0.
D) aggregate supply would shift to SRAS0 and LRAS1 would shift to LRAS0.

 C. Wright Mills (1916-1962) was a controversial figure in sociology because of his analysis of the ...
 Nancy Rubins, Pleasure Point.
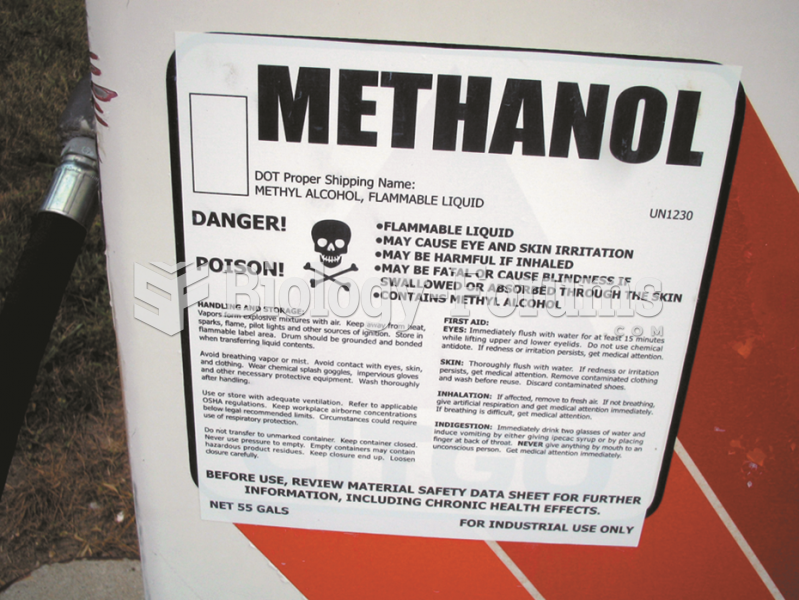 Sign on methanol pump shows that methyl alcohol is a poison and can cause skin irritation and other ...
 Chloroform has a boiling point of 61.1 degrees C and dichloromethane has a boiling point of 40 ...
 An inventory record sheet shows a balance on hand of 972. During the month units sold were 111, ...
 Bayesian Analysis of the Genotype of II-2 in Figure A.4