Figure 9.1 shows three aggregate demand curves. A movement from point b to point c could be caused by a(n)
A) decrease in government spending. B) decrease in the price level.
C) decrease in taxes. D) increase in the money supply.
Question 2
In the above figure, starting at E1, if there is a supply shock that is temporary, the
A) aggregate supply would shift to SRAS1 and LRAS0 would shift to LRAS1.
B) aggregate supply would shift to SRAS2 and LRAS0 would shift to LRAS1.
C) aggregate supply would shift to SRAS1 and then return to SRAS0.
D) aggregate supply would shift to SRAS0 and LRAS1 would shift to LRAS0.

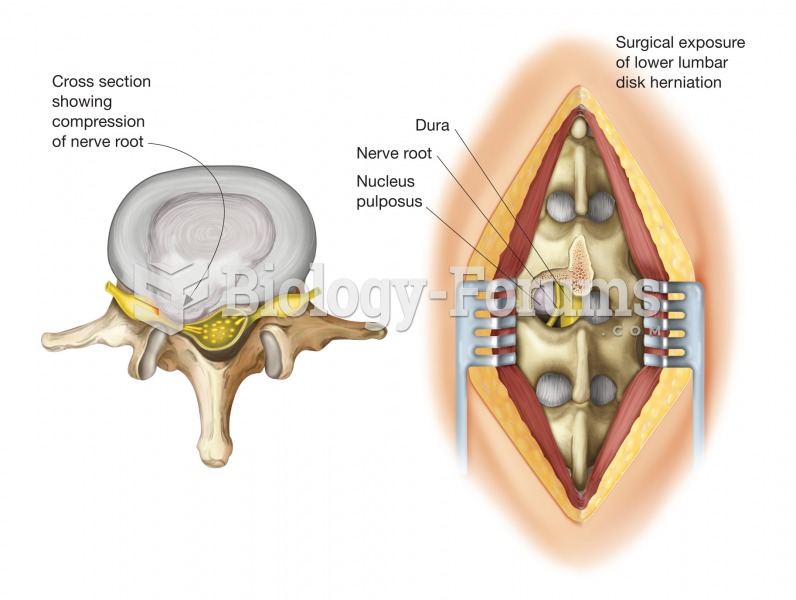 Herniated disk. A herniated disk is a protrusion of the disk’s gelatinous center, called the nucleus
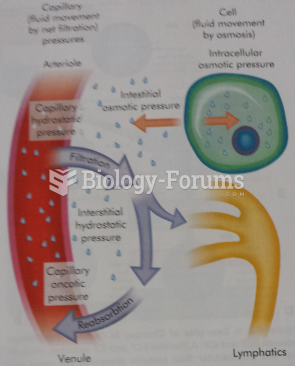 water movement
 Two-point linear perspective.
 Nancy Rubins, Pleasure Point.
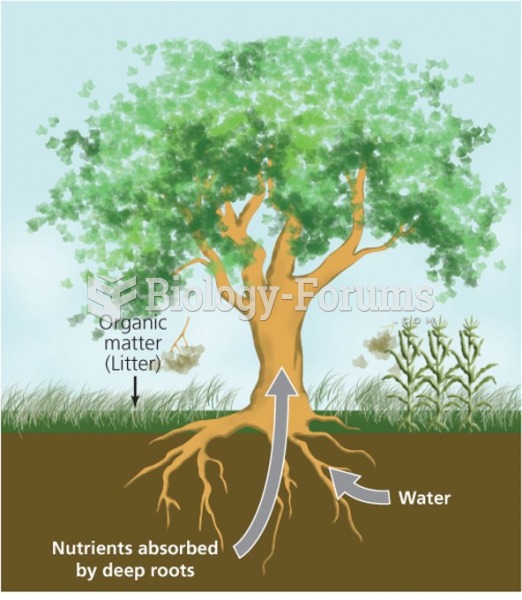 The movement of water and nutrient through a tree
 Sternocleidomastoid muscle movement