In the above figure, what are the long-run equilibrium price level and real GDP?
A) 130 and 11.5 trillion B) 120 and 11.5 trillion
C) 120 and 12 trillion D) 130 and 12 trillion
Question 2
Which one of the following statements is TRUE?
A) Over the years, real consumption spending has been more volatile than real investment spending.
B) In the Keynesian model, changes in the volume of real investment spending are fully explained by changes in the real interest rate.
C) Domestic real investment in the United States was highest during the Great Depression.
D) Over the years, real investment spending has been more volatile than real consumption spending.

 Historian James Merrell notes several errors in Benjamin West’s famous 1771 painting, William Penn’s
 Homeschooling has come a long way. These children are performing in a musical at the annual ...
 How to create a price index to calculate inflation for a basket of goods
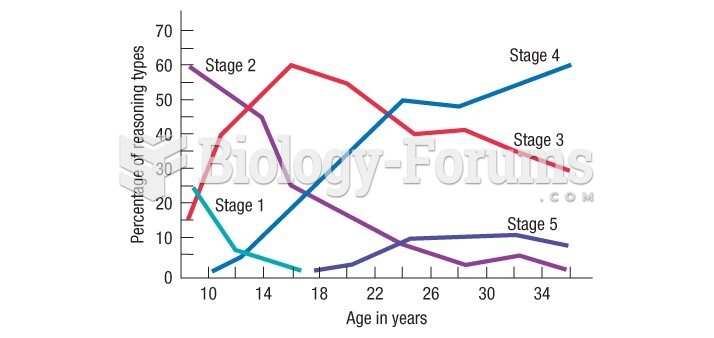 These findings are from Colby and Kohlberg's long-term longitudinal study
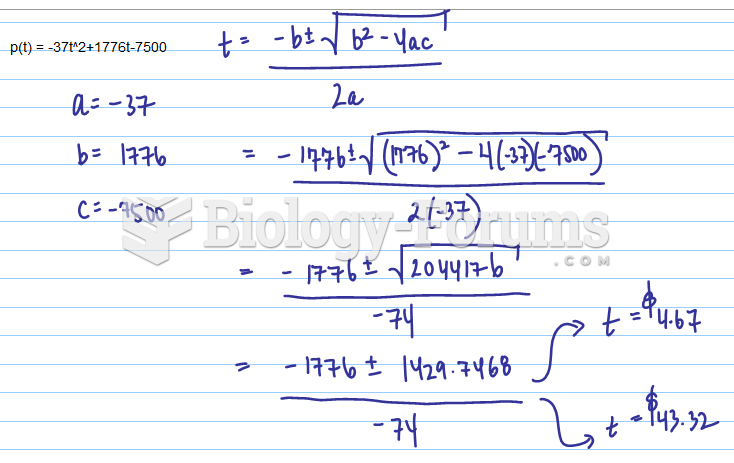 The profit, p(t), made at a fair depends on the price of the ticket, t. The profit is modelled ...
 Lod Score Values for the Families in Figure 5.15