In the above figure, what are the long-run equilibrium price level and real GDP?
A) 130 and 11.5 trillion B) 120 and 11.5 trillion
C) 120 and 12 trillion D) 130 and 12 trillion
Question 2
Which one of the following statements is TRUE?
A) Over the years, real consumption spending has been more volatile than real investment spending.
B) In the Keynesian model, changes in the volume of real investment spending are fully explained by changes in the real interest rate.
C) Domestic real investment in the United States was highest during the Great Depression.
D) Over the years, real investment spending has been more volatile than real consumption spending.

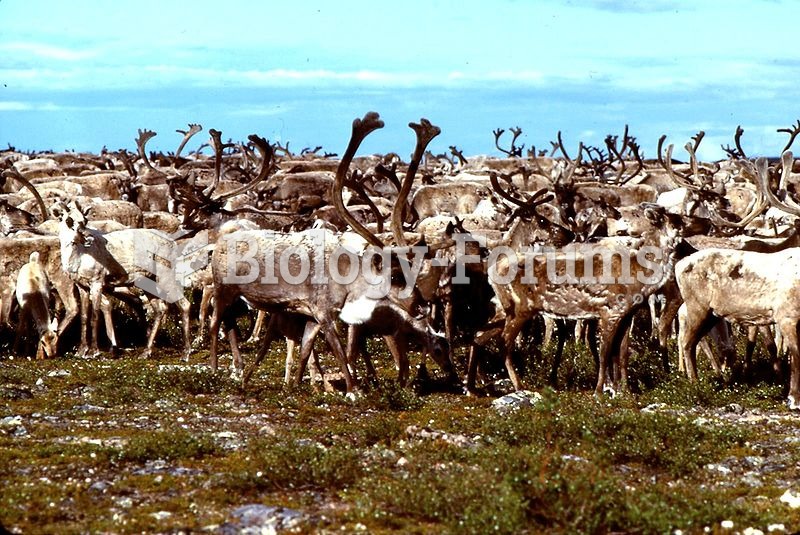 A herd of barren-ground caribou at the Thelon River. This subspecies is a long-distance migrant
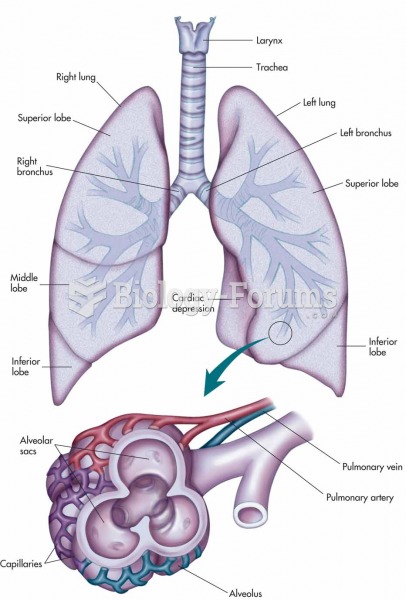 Larynx, trachea, bronchi, and lungs with an expanded view showing the structures of an alveolus and
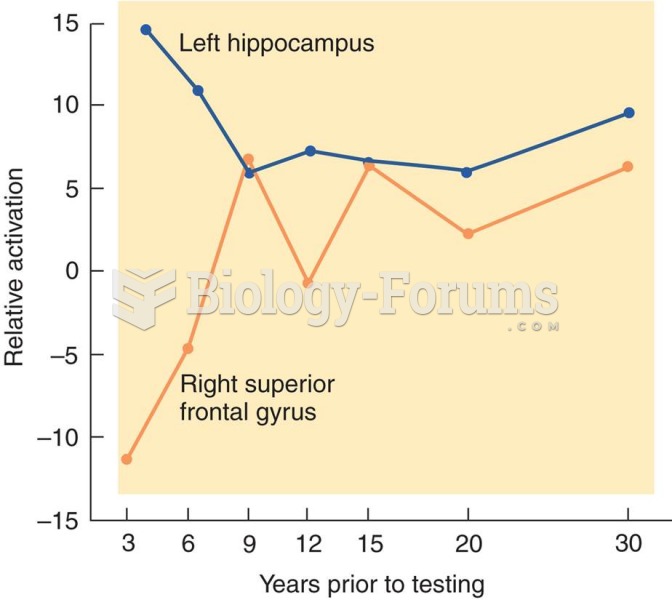 The Role of the Hippocampus and Cerebral Cortex in Long-Term Memory Storage
 Are reality shows “real”? Does the media tell the “truth”?
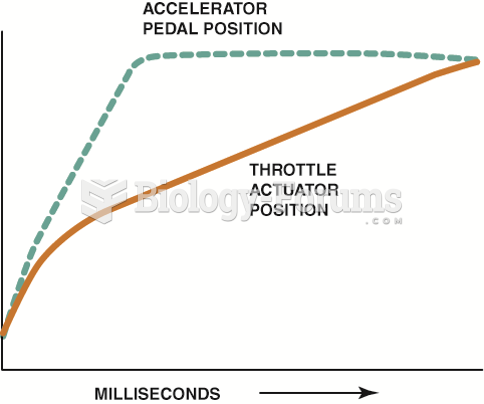 The opening of the throttle plate can be delayed as long as 30 milliseconds (0.030 sec) to allow ...
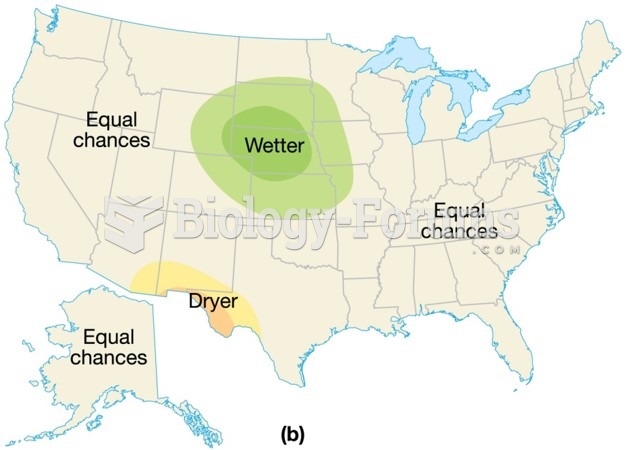 Long-range forecasts