From 2009 to 2012
A) The Beveridge curve became flat.
B) The Beveridge curve shifted to the right.
C) The Beveridge curve cannot be discerned in the data.
D) The Beveridge curve shifted to the left.
Question 2
If a person completely smooths consumption over his lifetime, then consumption is best represented by which of the following?
A) wealth / the number of years the person expects to live
B) lifetime income / the number of years the person expects to work
C) (wealth + lifetime income) / the number of years the person expects to live
D) (wealth + lifetime income) / the number of years the person expects to work

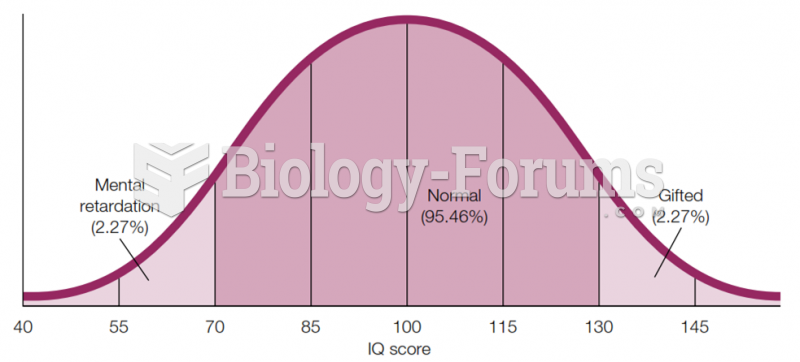 Bell Curve for Intelligence IQ scores for a population-based sample usually fall into this kind of
 Use a full hand/flat of fingers to apply L stroke to face, below the eye and to the edge of the ...
 The U.S. DOT hazardous materials placards as found in the 2012 Emergency Response Guidebook. ...
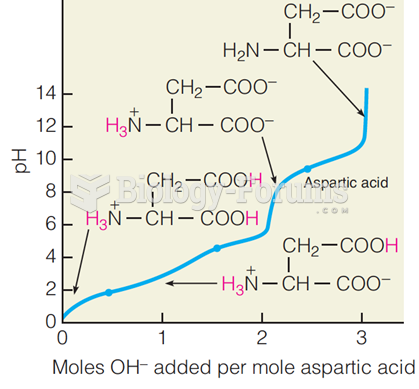 Titration curve for aspartic acid
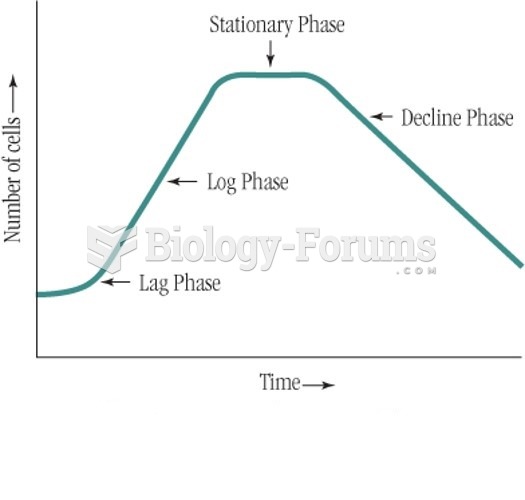 Bacteria growth curve
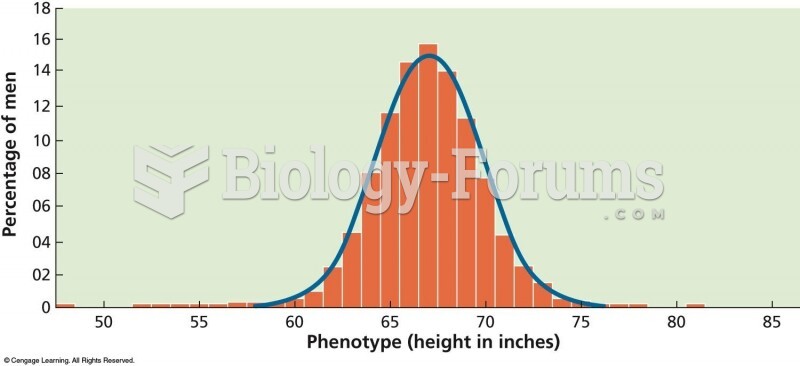 A bell-shaped, or “normal,” curve shows the distribution of phenotypes for traits controlled by ...