From 2009 to 2012
A) The Beveridge curve became flat.
B) The Beveridge curve shifted to the right.
C) The Beveridge curve cannot be discerned in the data.
D) The Beveridge curve shifted to the left.
Question 2
If a person completely smooths consumption over his lifetime, then consumption is best represented by which of the following?
A) wealth / the number of years the person expects to live
B) lifetime income / the number of years the person expects to work
C) (wealth + lifetime income) / the number of years the person expects to live
D) (wealth + lifetime income) / the number of years the person expects to work

 A theoretical photosynthetic response curve.
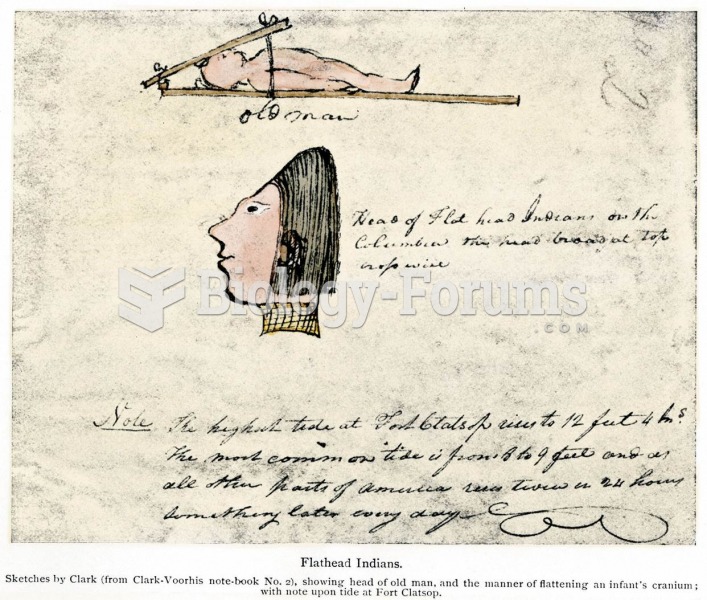 The “Flat Head” (Chinook) Indians acquired their name through shaping in infancy, as shown in a diag
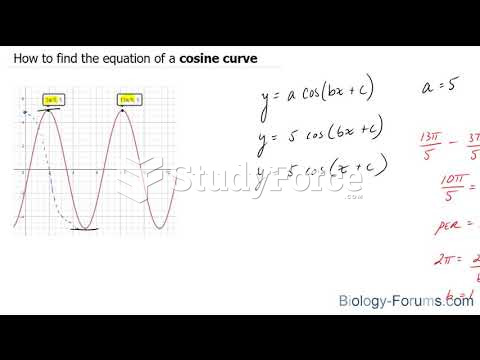 How to find the equation of a cosine curve
 The U.S. DOT hazardous materials placards as found in the 2012 Emergency Response Guidebook. ...
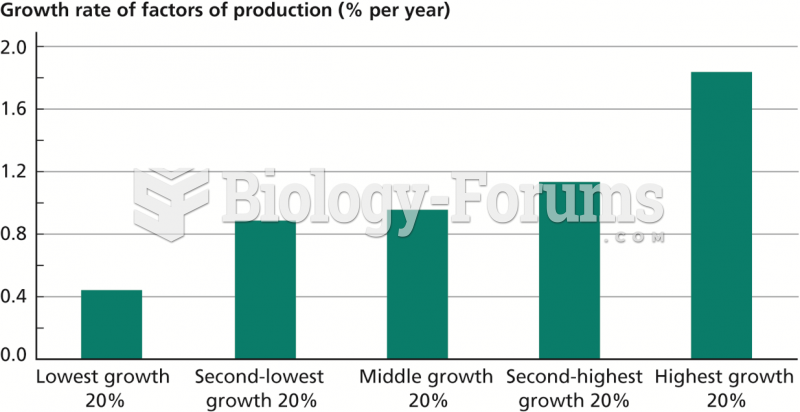 Role of Factors of Production in Determining Growth, 1975–2009
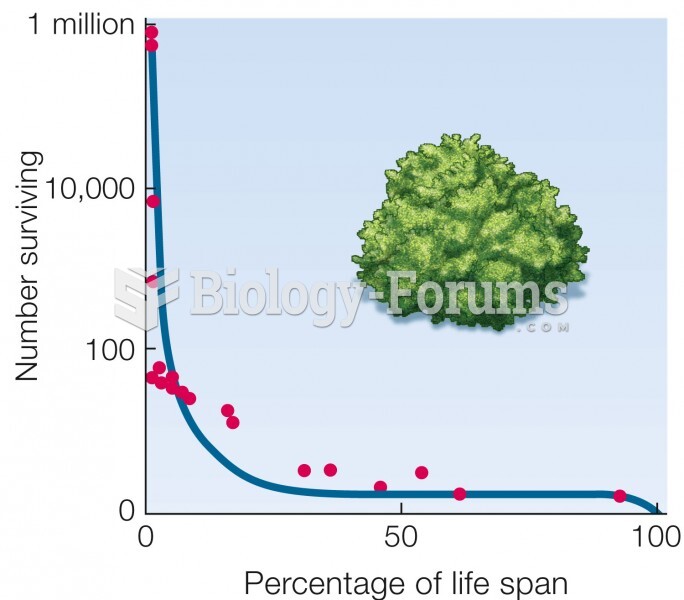 Type III curve. Mortality is highest early in life. Data for a desert shrub (Cleome droserifolia).