|
|
|

 Multiplexed fluorescent microbead assays. Multiplex analysis for the ENA antigens, Sm, RNP, SS-A, ...
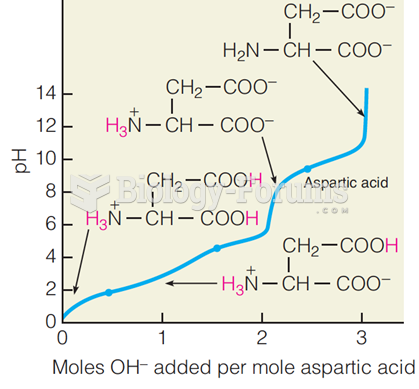 Titration curve for aspartic acid
 Classic Supply - Demand Curve
 Testing the arterial supply to the lower extremities
 What cause the white spot area on throat?
 QTL Analysis of Tomato Weight in Backcross Progeny