|
|
|

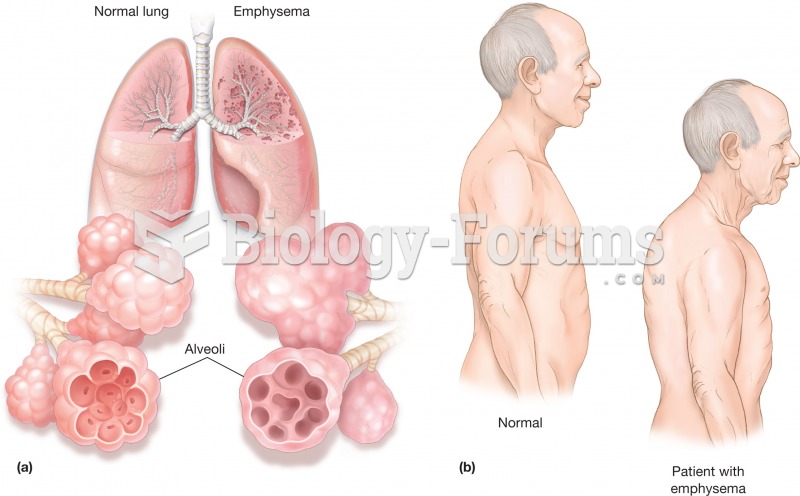 Emphysema. (a) Illustration comparing normal lungs and emphysemic lungs. The inserts illustrate how
 Aerial view of old hutong area, Beijing.
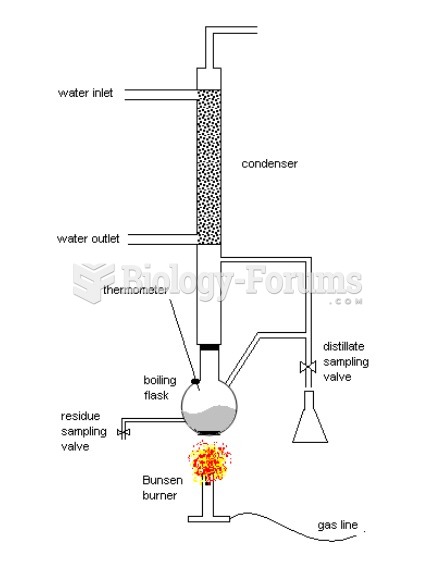 Othmer’s Equilibrium Still Schematic Diagram
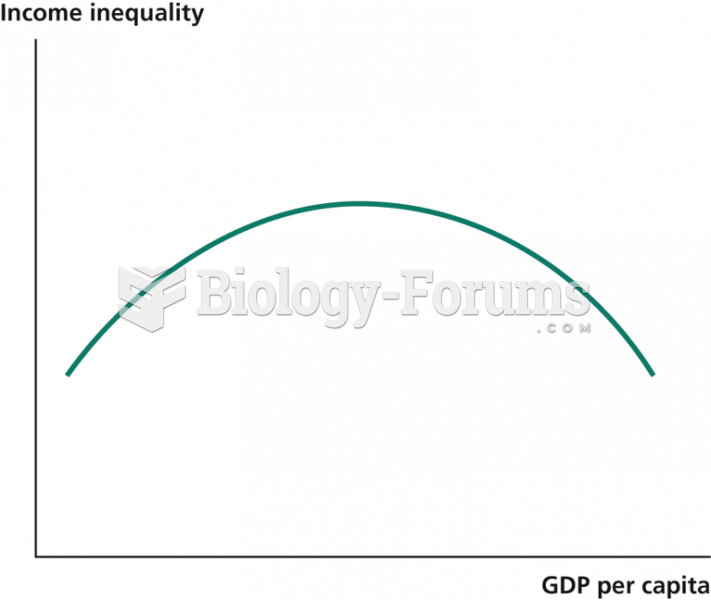 The Kuznets Curve
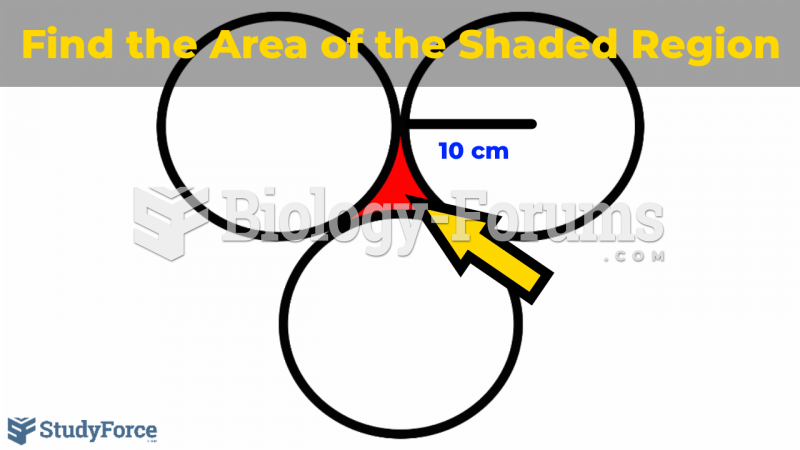 WHAT IS THE AREA OF THE REGION SHADED IN RED?
 Swot analysis