|
|
|
Nearly 31 million adults in America have a total cholesterol level that is more than 240 mg per dL.
In inpatient settings, adverse drug events account for an estimated one in three of all hospital adverse events. They affect approximately 2 million hospital stays every year, and prolong hospital stays by between one and five days.
More than 20 million Americans cite use of marijuana within the past 30 days, according to the National Survey on Drug Use and Health (NSDUH). More than 8 million admit to using it almost every day.
Disorders that may affect pharmacodynamics include genetic mutations, malnutrition, thyrotoxicosis, myasthenia gravis, Parkinson's disease, and certain forms of insulin-resistant diabetes mellitus.
A cataract is a clouding of the eyes' natural lens. As we age, some clouding of the lens may occur. The first sign of a cataract is usually blurry vision. Although glasses and other visual aids may at first help a person with cataracts, surgery may become inevitable. Cataract surgery is very successful in restoring vision, and it is the most frequently performed surgery in the United States.
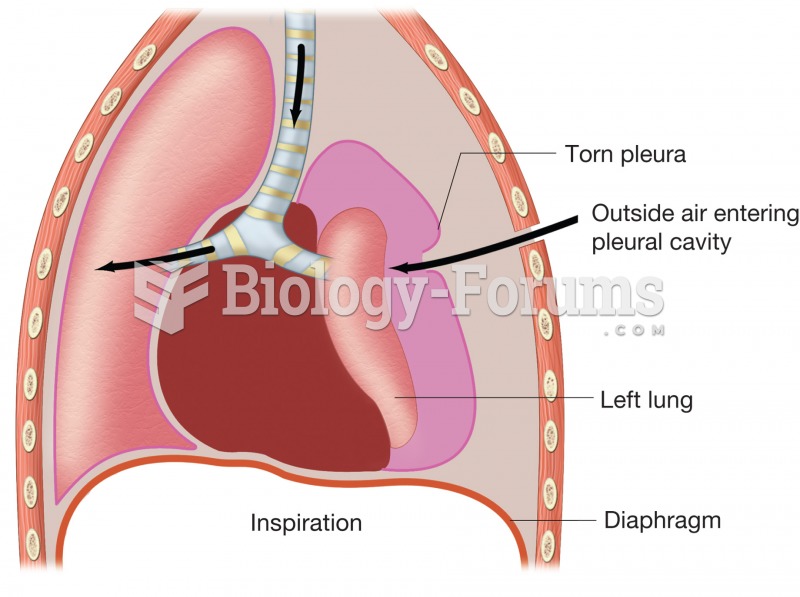
 Pneumothorax. Figure illustrates how puncture of thoracic wall and tearing of pleural membrane allow
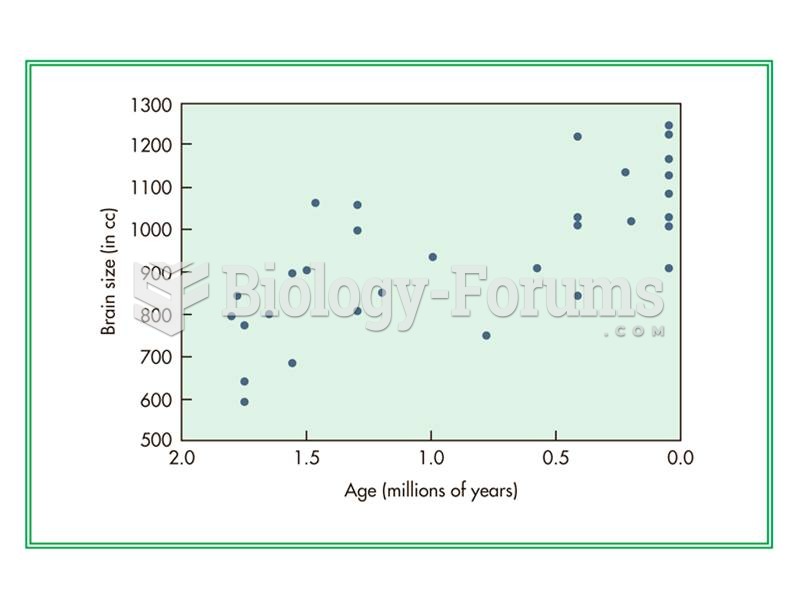
 Although average brain size increases gradually though time in H. erectus, individuals with small br
 Although the Democrats and the Republicans represent slightly different slices of the center, those ...


