This topic contains a solution. Click here to go to the answer
|
|
|

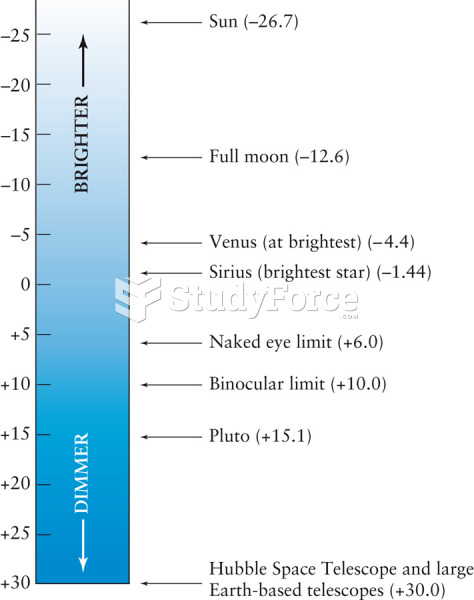 Apparent Magnitude Scale
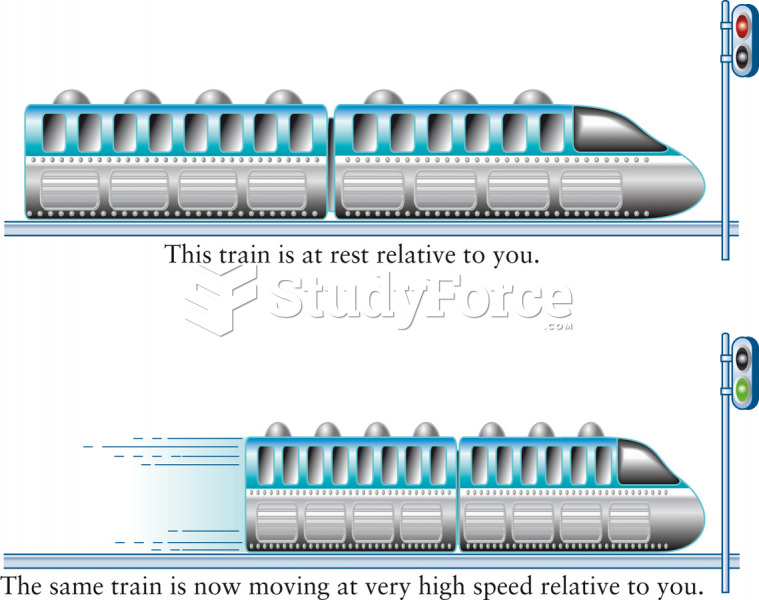 Movement and Space
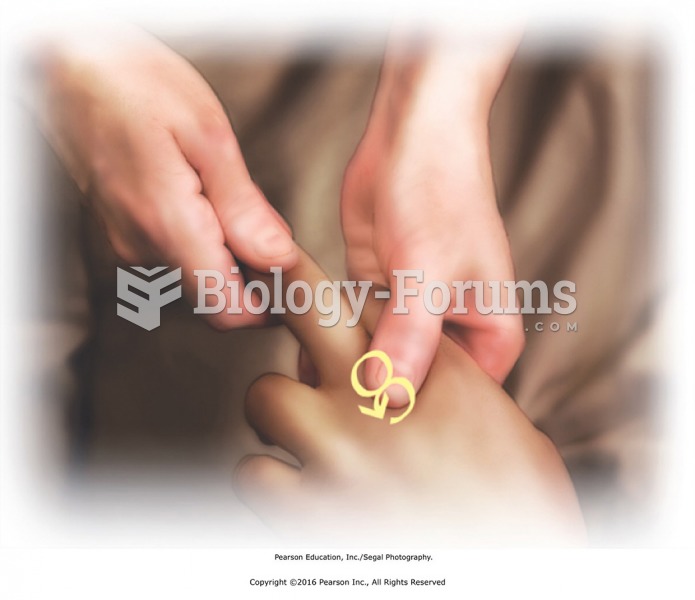 Mobilize the joints in the hand. Follow with figure-8s at the knuckles and scissoring the ...
 Mobilize each metatarsal–phalangeal joint with figure-8s. Hold the tarsal just below the ...
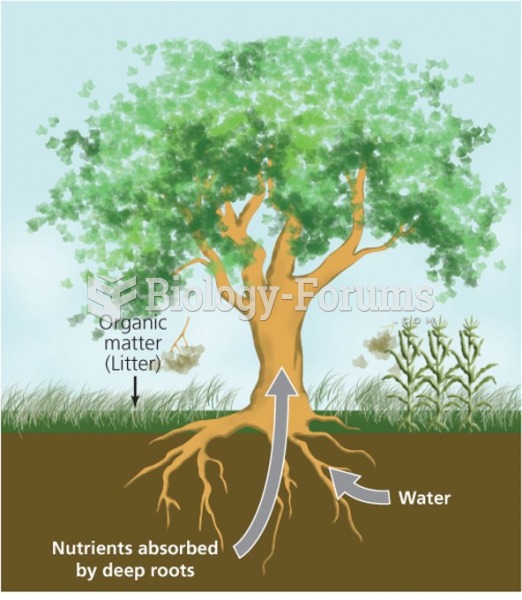 The movement of water and nutrient through a tree
 Growth in Closed Economies