This topic contains a solution. Click here to go to the answer
|
|
|

 Graph of 3 compounds tested
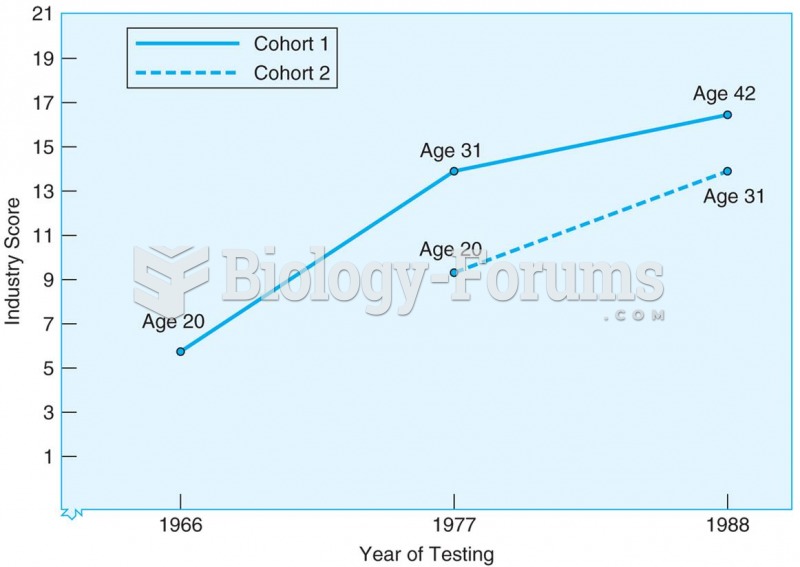 Results from sequential study of two cohorts tested at three ages and at three different points in t
 A cartoon of “King Andrew the First” shows Jackson standing atop the U.S. Constitution—a scepter in
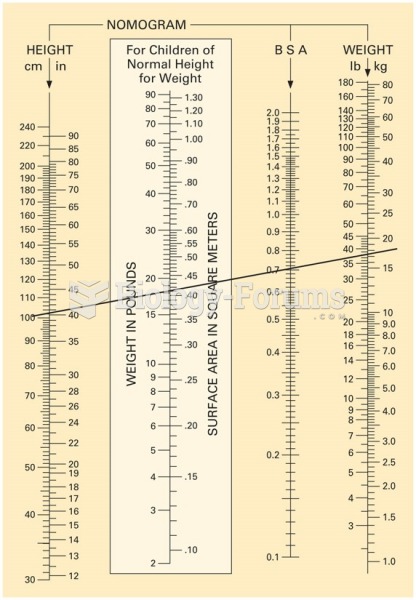 Nomogram chart. This example shows a line drawn from a child’s height of 100 cm to his weight, 35 ...
 Competitive enzyme immunoassay. (a) Shows the uninhibited reaction and (b) shows the inhibited ...
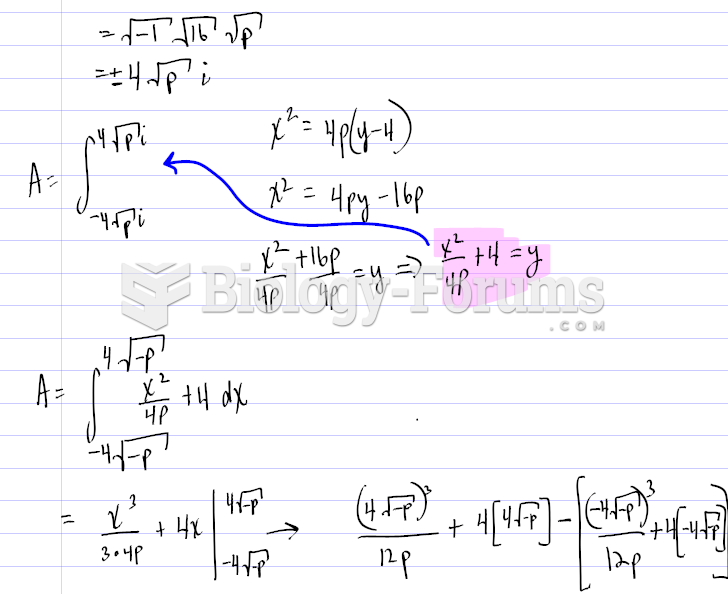 Finding the graph of a Parabola using certain values