This topic contains a solution. Click here to go to the answer
|
|
|

 Photograph of a brain specimen with a large malignant tumor.
 Lewis symbols,(Figure 1)
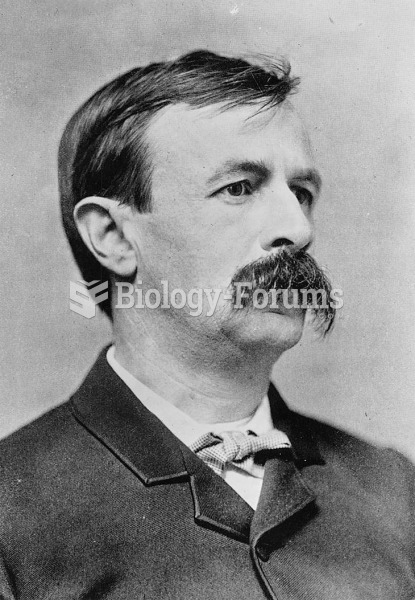 Edward Bellamy, author of the utopian novel Looking Backward (1888) Bellamy’s socialism worried many
 Small Town USA: Struggling to Survive
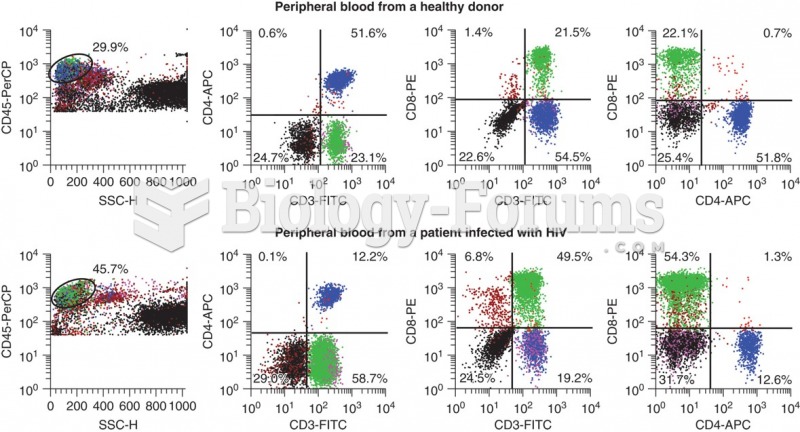 Flow cytometry data that shows the differences in CD3+ CD4+ cells that occur with HIV infection. ...
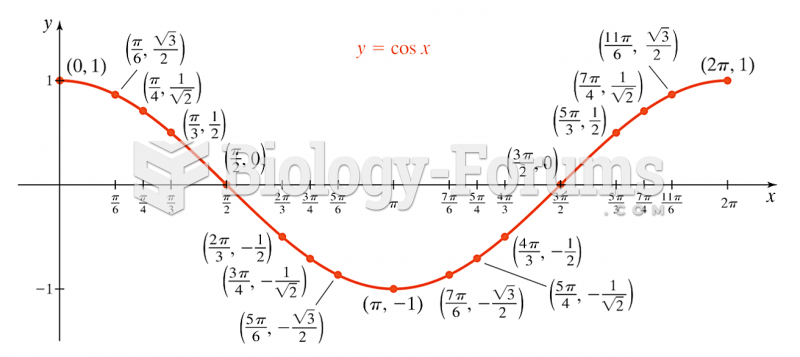 Graph of cos(x)