This topic contains a solution. Click here to go to the answer
|
|
|

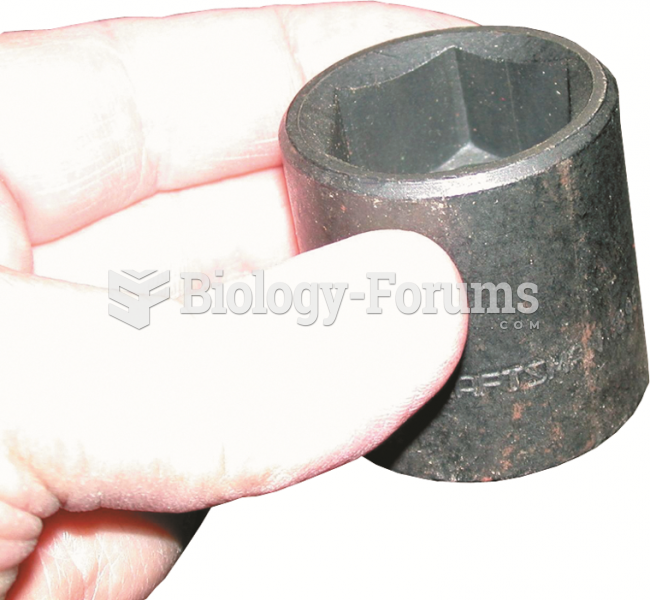 A black impact socket. Always use an impact-type socket whenever using an impact wrench to avoid ...
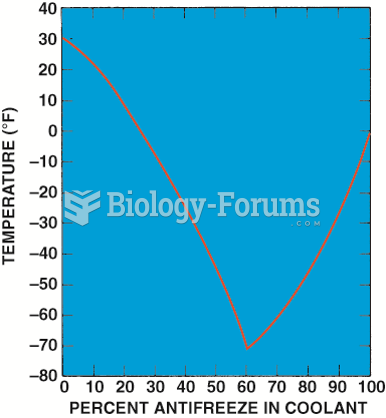 Graph showing the relationship between the freezing point of the coolant and the percentage of ...
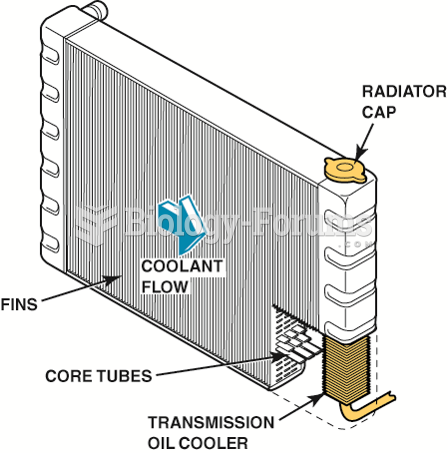 A radiator may be either a down-flow or a cross-flow type.
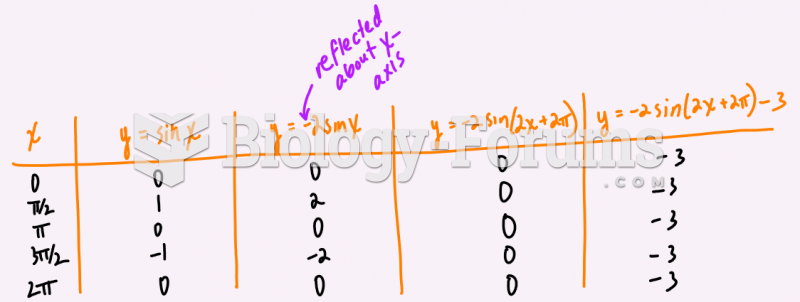 State the transformations on the function f(x)= 4sin(x-pi)-2 and then graph two cycles below.
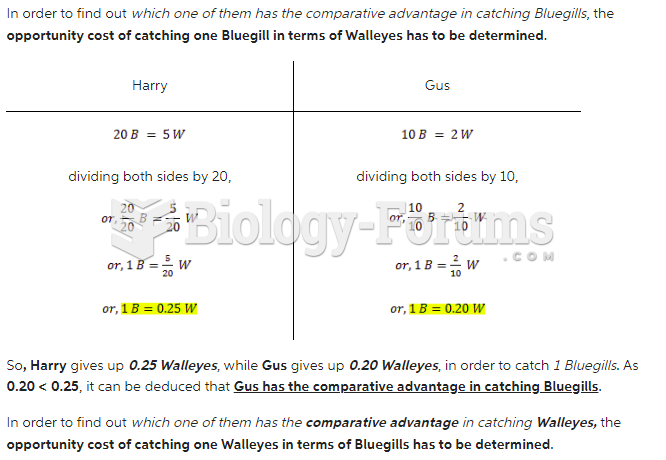
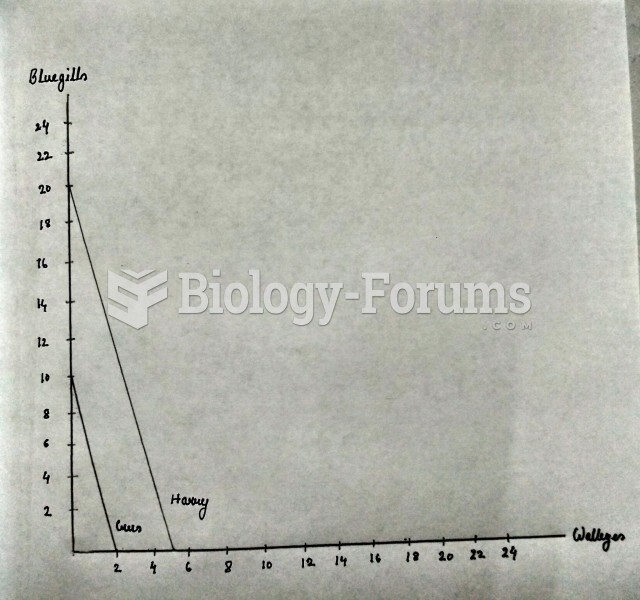 Harry and Gus fish the same lake together from the same boat. Each morning Harry typically ...
 Harry and Gus fish the same lake together from the same boat. Each morning Harry typically ...