This topic contains a solution. Click here to go to the answer
|
|
|

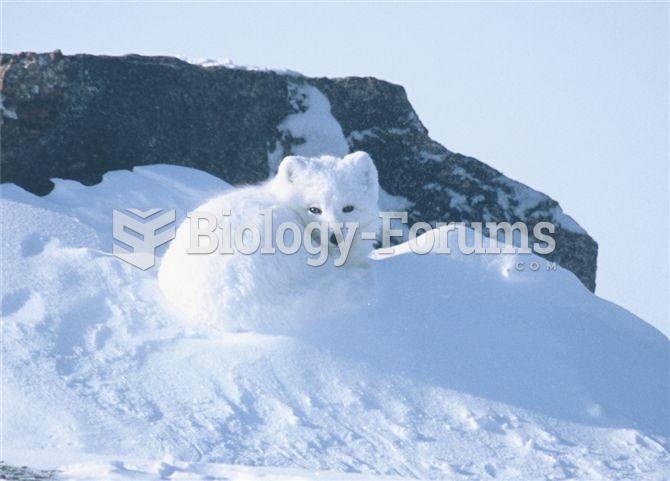 Organisms exhibit a diversity of behaviours, which include (clockwise from upper left), foraging and
 Treatment of Depression with Ketamine The graph shows the effects of ketamine on symptoms of depress
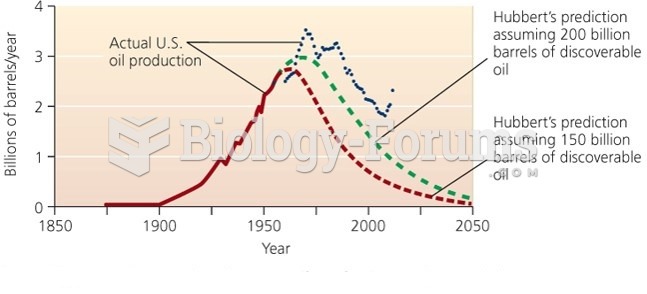 Hubbard’s Predication of Peak in U.S Oil Production with Actual Data
 Data for Calculating Productivity Growth in Erewhon
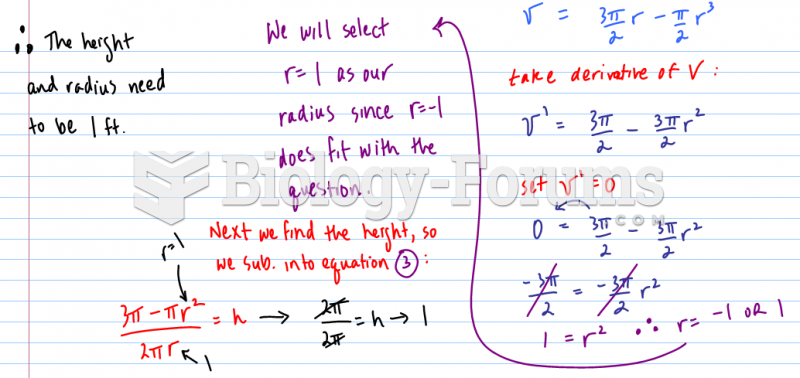 A container in the shape of a right circular cylinder with no top has surface area square feet.
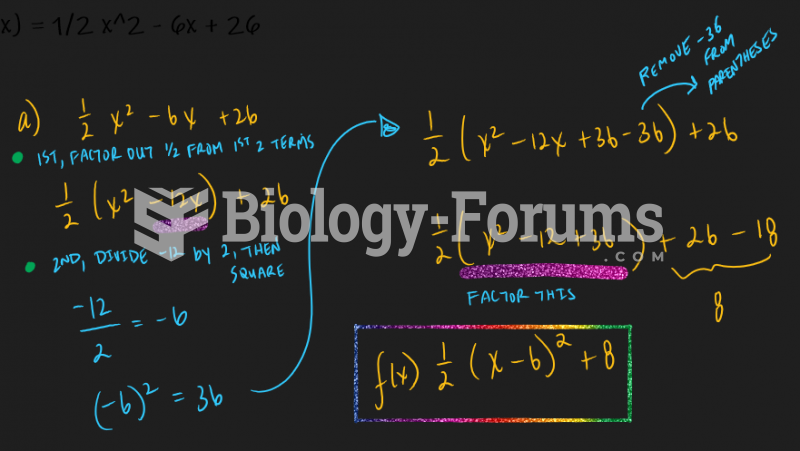 Write in vertex form by completing the square