This topic contains a solution. Click here to go to the answer
|
|
|

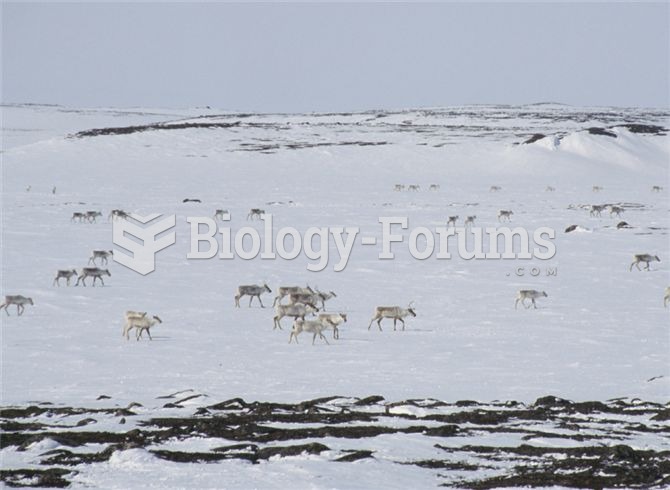 Organisms exhibit a diversity of behaviours, which include (clockwise from upper left), foraging and
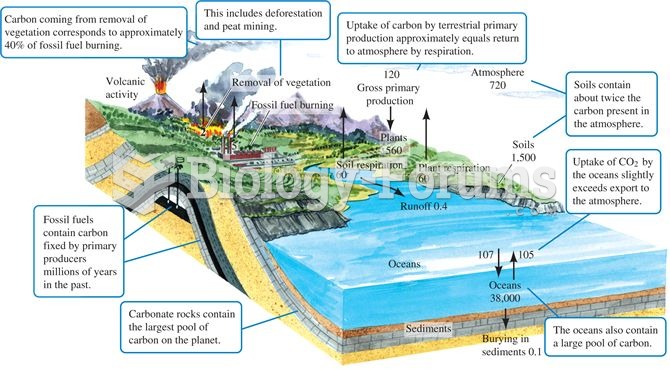 The carbon cycle. Numbers are storage as 1015 g or fluxes as 1015 g per year (data from Schlesinger
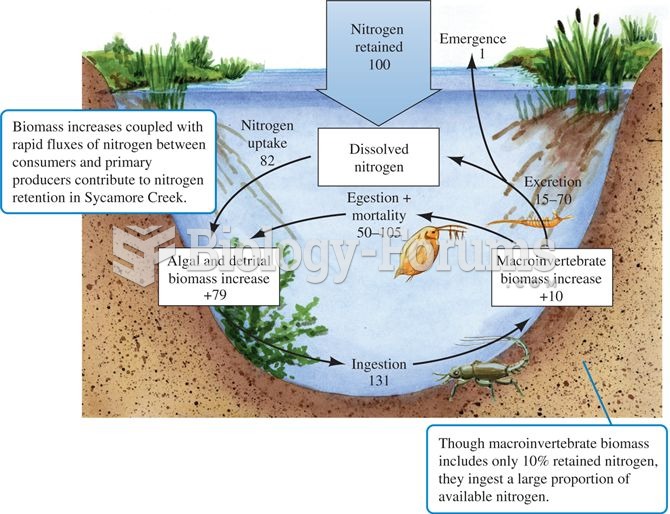 Nitrogen fluxes in Sycamore Creek, Arizona (data from Grimm 1988).
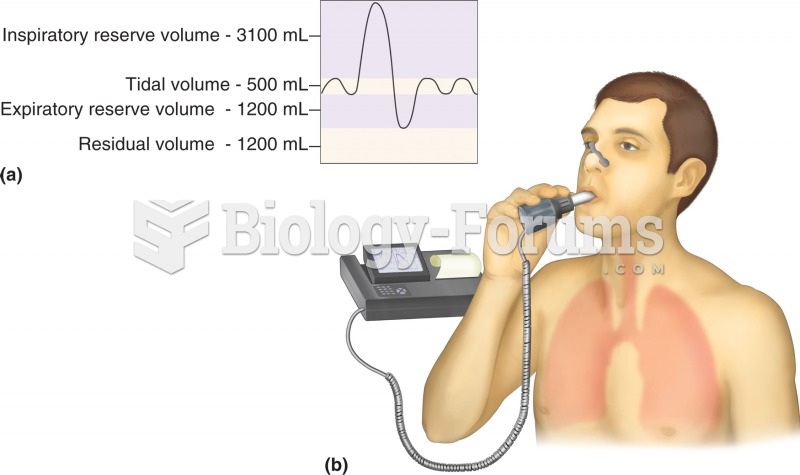 Pulmonary function test: spirometry. (a) Normal respiratory volumes, as measured during spirometry.
 Electronic service information is available from aftermarket sources, such as All-Data and ...
 Sponge bob square pants kindergarten drawing