|
|
|

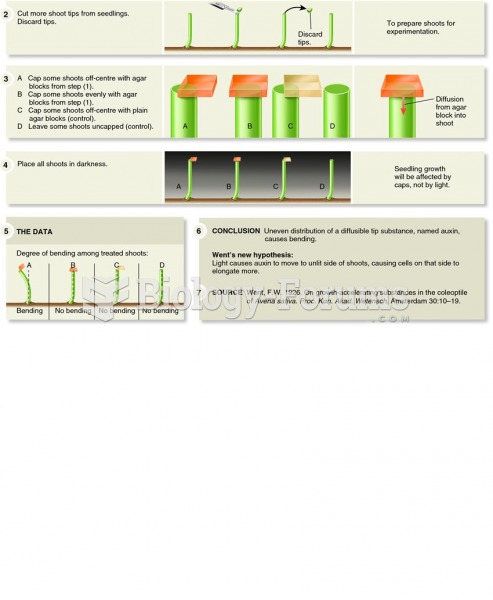 Went and Briggs demonstrated the relationship between light perception and auxin function.
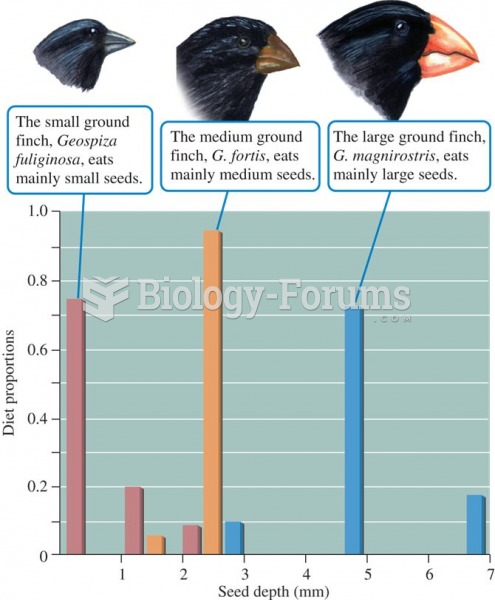 Relationship between body size and seed size in Galapagos finch species
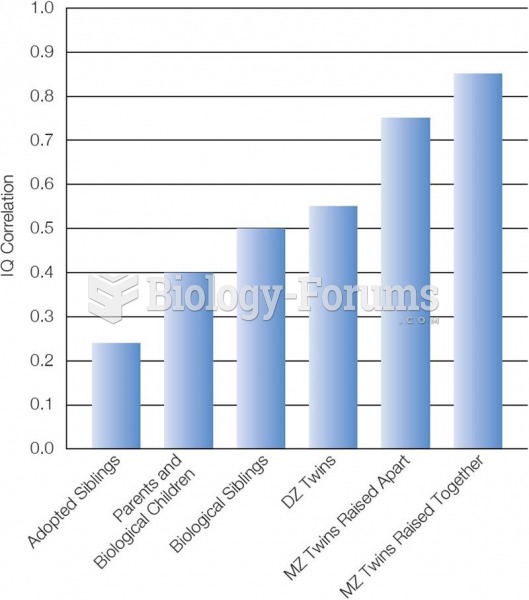 IQ and Genetics The closer the genetic relationship, the higher the correlation in IQ. Based on: Br
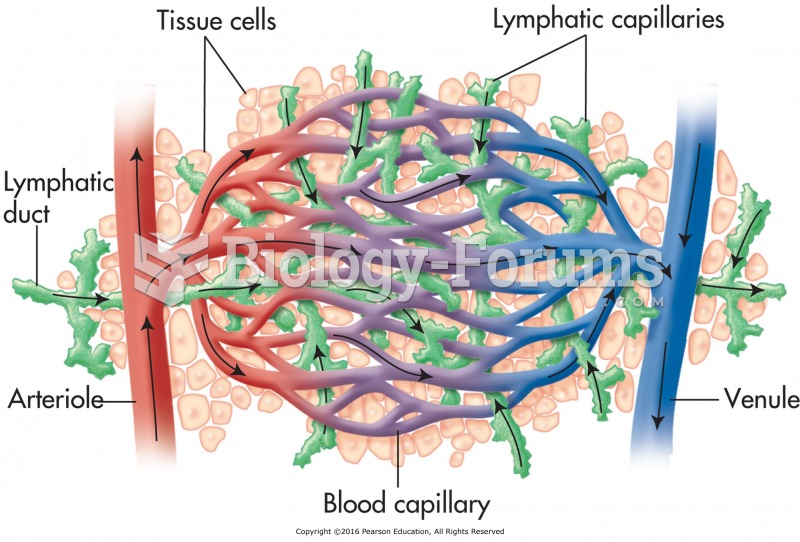 Relationship between blood and lymph capillaries.
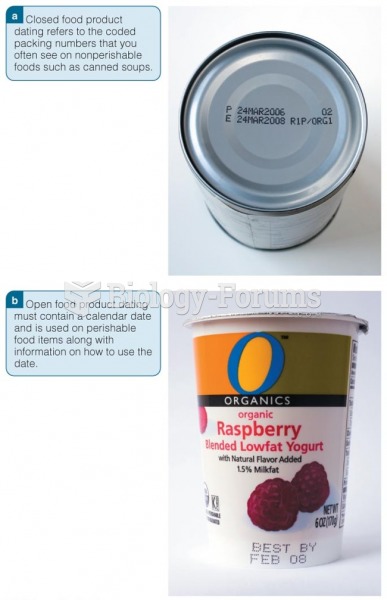 Closed and Open Food Product Dating
 The pH scale and relationship between bicarbonate and carbonic acid