|
|
|

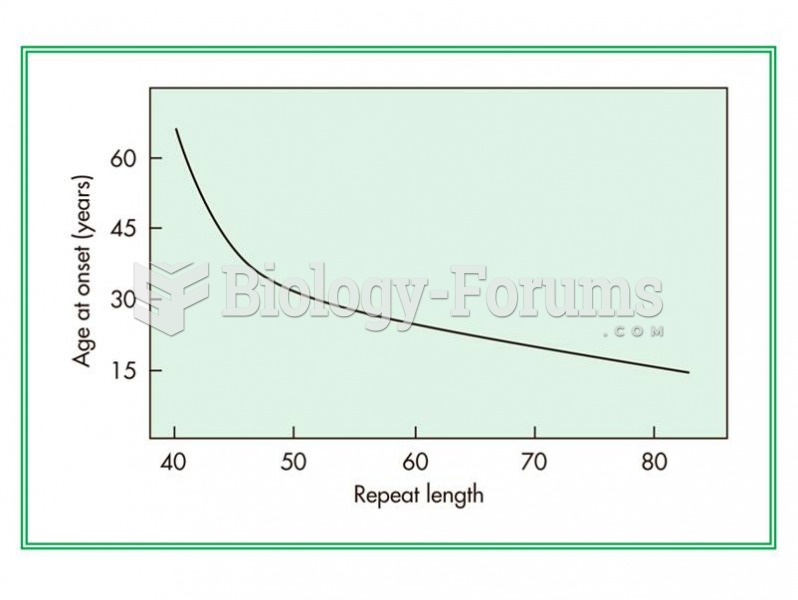 Relationship between the number of CAG repeats in a gene and the age of onset of Huntington disease.
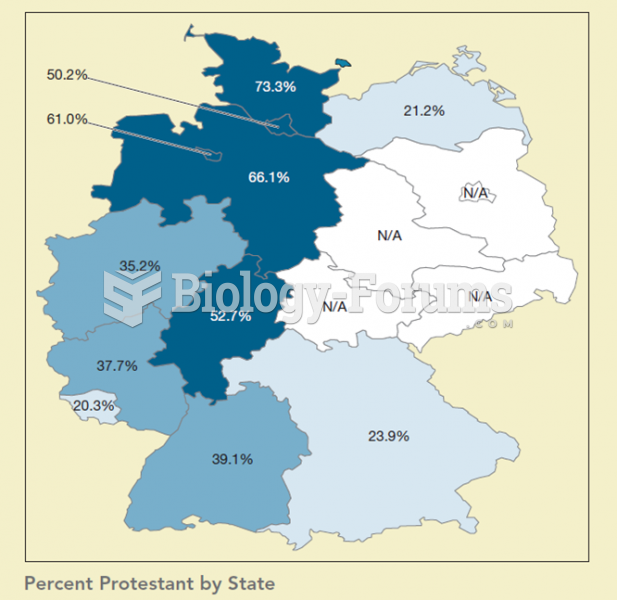 This map shows the percentage of Protestants by state in Germany. When compared to the previous map
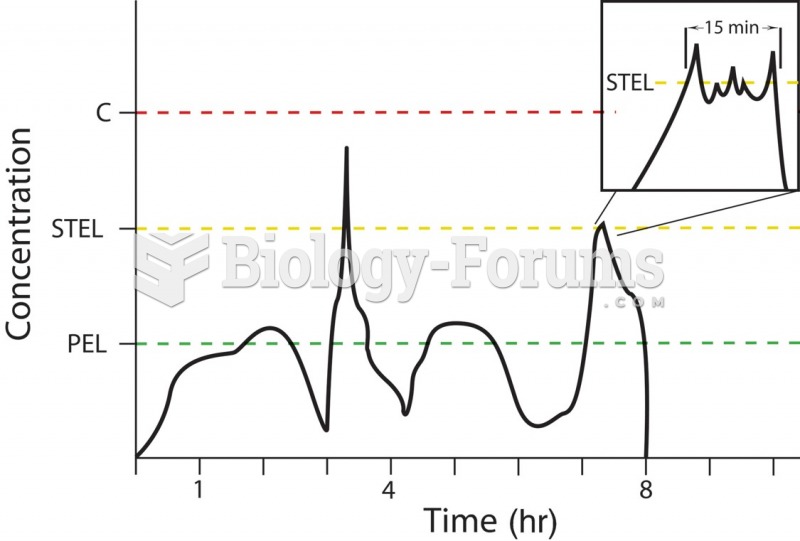 The relationship between the permissible exposure limit (PEL), the short-term exposure limit (STEL), ...
 Infant and Toddler Development and Responsive Program Planning: A Relationship-Based Approach
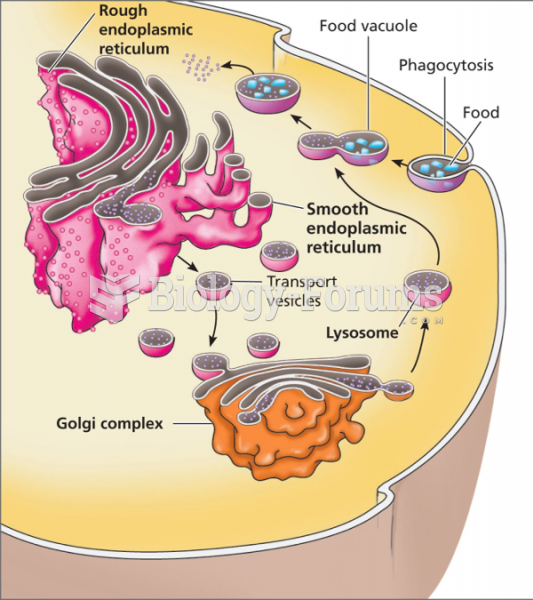 The relationship between the Golgi complex and lysosomes
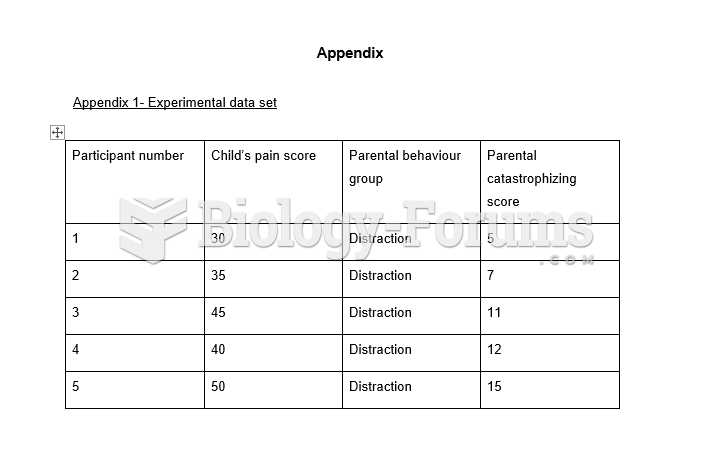 Table - Correlation Analysis