|
|
|

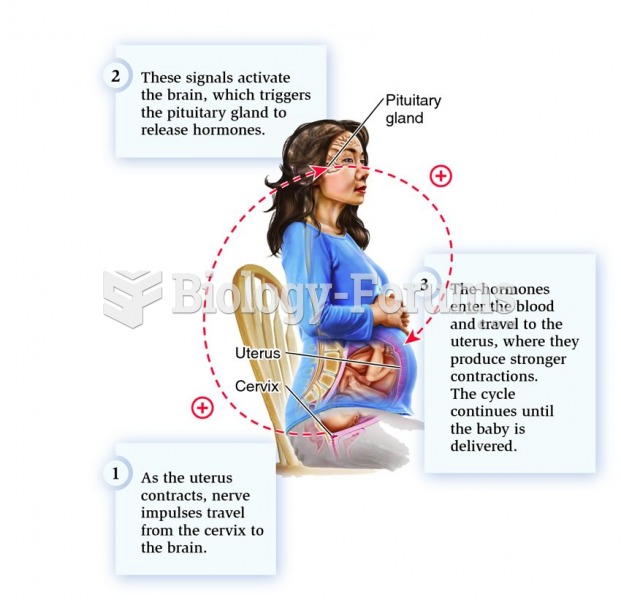 The human birth process as an example of positive feedback.
 Use of the tympanic thermometer to measure body temperature.
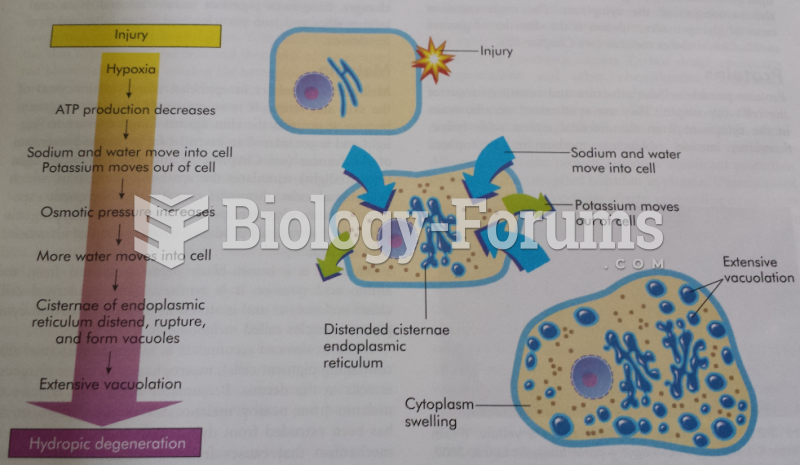 Oncosis Process
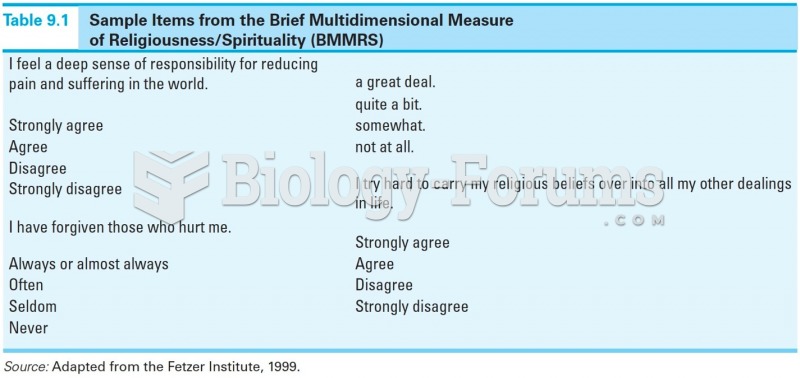 Sample Items from the Brief Multidimensional Measure of Religiousness/Spirituality (BMMRS)
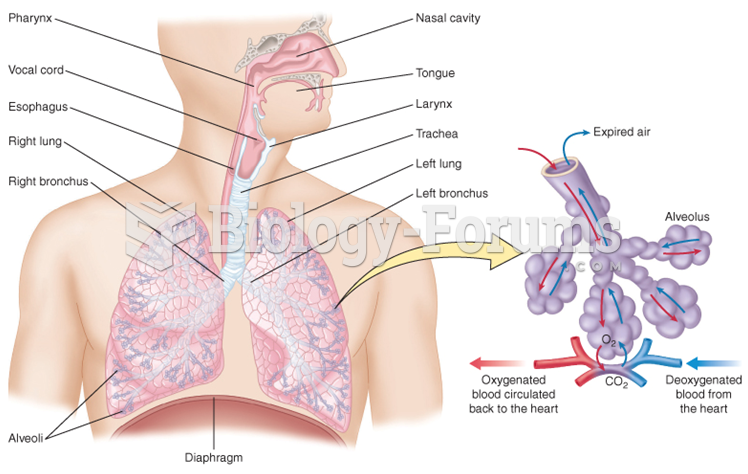 The respiratory system and the process of gas exchange
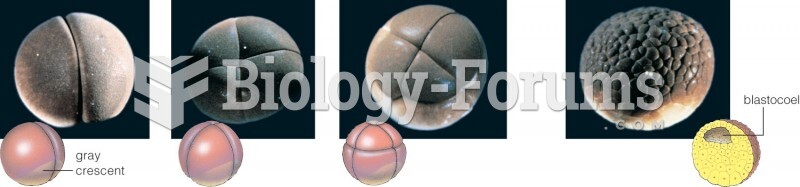 Here we show the first three divisions of cleavage, a process that carves up a zygote’s cytoplasm. ...