|
|
|

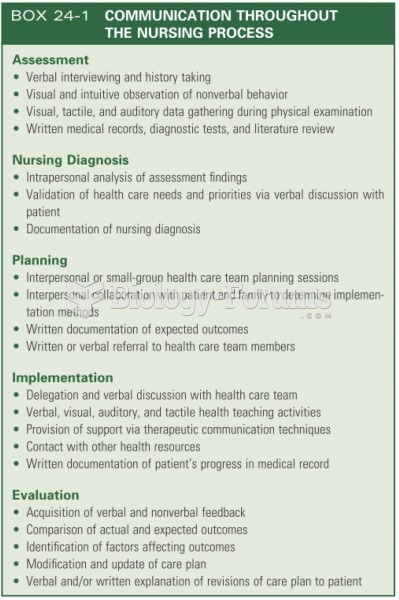 Communication throughout the nursing process
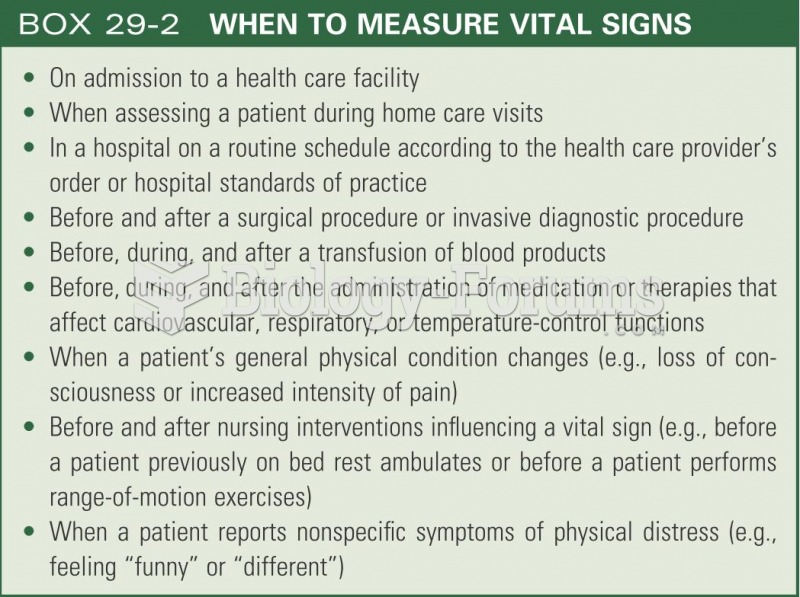 When to measure vital signs
 Calipers being used to measure body fat on the triceps of a patient.
 Performing a Spirometry Test to Measure Forced Vital Capacity
 Deliberative nursing is a constant process of validating perceptions, thoughts, and feelings.
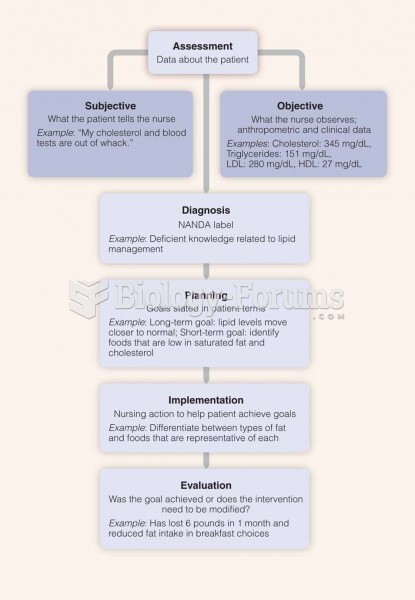 Nursing Care Plan Process: Client with High Blood Lipid Levels