Answer to Question 1
ANS: A, D
Scatter plots or scatter diagrams provide useful preliminary information about the nature of the relationship between variables. The researcher should develop and examine scatter diagrams before performing correlational analysis. Scatter plots may be useful for selecting appropriate correlational procedures, but most correlational procedures are useful for examining linear relationships only. A scatter plot can easily identify nonlinear relationships; if the data are nonlinear, the researcher should select statistical alternatives such as nonlinear regression analysis. A scatter plot is created by plotting the values of two variables on an x and y axis.
Answer to Question 2
ANS: A, C, E
Correlational analysis provides two pieces of information about the data: the nature or direction of the linear relationship (positive or negative) between the two variables and the magnitude (or strength) of the linear relationship. In a negative linear relationship, when one value is high, the other value tends to be low. The probability of rejecting the null hypothesis when it is in fact true is called type I error, and it is impossible to know whether it has occurred until replication research takes place. Operationalization of a variable indicates how it will be measured or manipulated in a study; without operationalization, no measurement can occur.

 Ramachandran plot for L-Ala residues
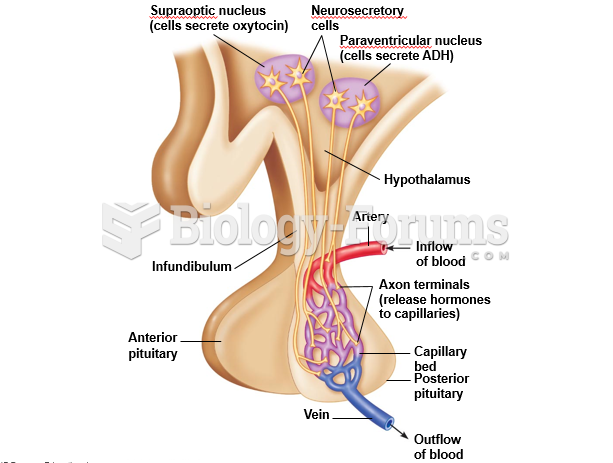 Connection between the hypothalamus and the posterior pituitary gland.
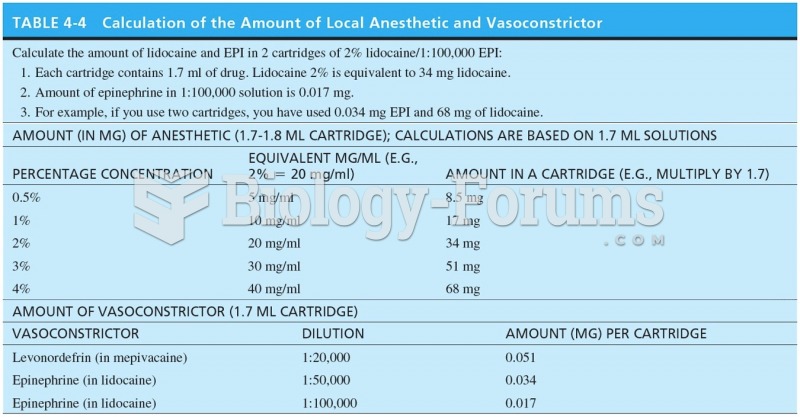 Calculation of the Amount of the Local Anesthetic and Vasoconstrictor
 Select the changes in the embryo that indicate that a blastocyst has formed. 3 options: t
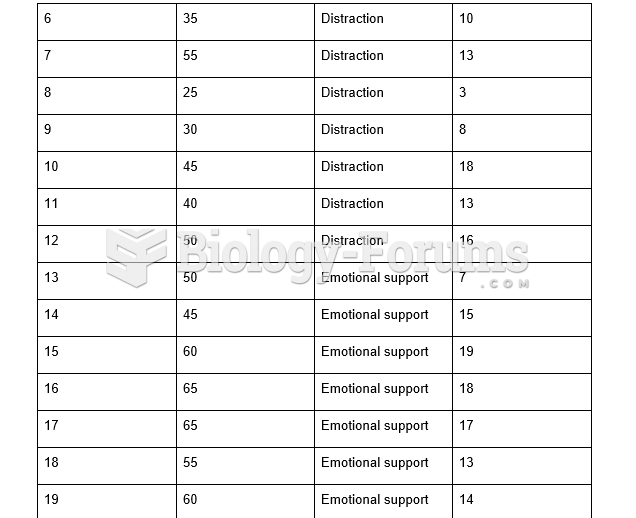 Table - Correlation Analysis
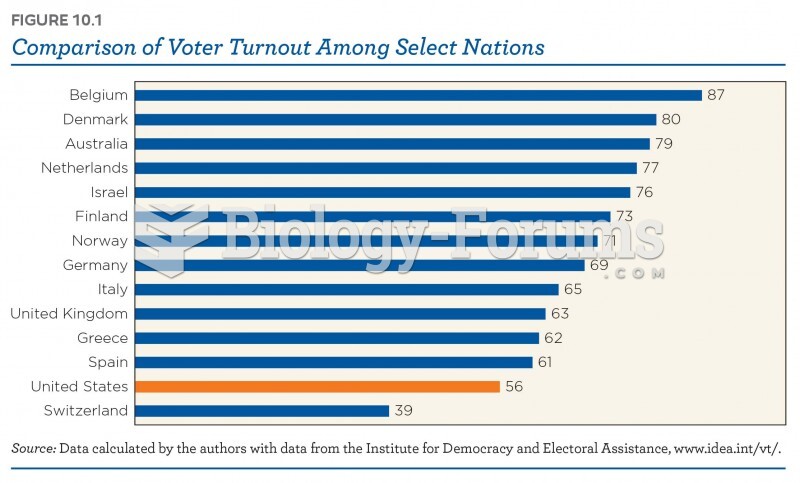 Comparison of Voter Turnout among select nations