Answer to Question 1
ANS: A, D
Scatter plots or scatter diagrams provide useful preliminary information about the nature of the relationship between variables. The researcher should develop and examine scatter diagrams before performing correlational analysis. Scatter plots may be useful for selecting appropriate correlational procedures, but most correlational procedures are useful for examining linear relationships only. A scatter plot can easily identify nonlinear relationships; if the data are nonlinear, the researcher should select statistical alternatives such as nonlinear regression analysis. A scatter plot is created by plotting the values of two variables on an x and y axis.
Answer to Question 2
ANS: A, C, E
Correlational analysis provides two pieces of information about the data: the nature or direction of the linear relationship (positive or negative) between the two variables and the magnitude (or strength) of the linear relationship. In a negative linear relationship, when one value is high, the other value tends to be low. The probability of rejecting the null hypothesis when it is in fact true is called type I error, and it is impossible to know whether it has occurred until replication research takes place. Operationalization of a variable indicates how it will be measured or manipulated in a study; without operationalization, no measurement can occur.

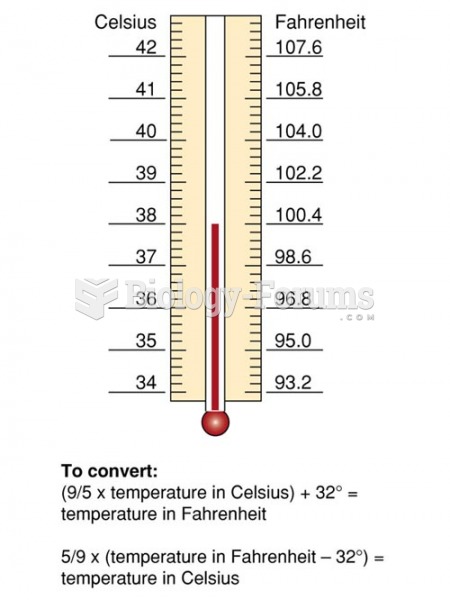 Correlation between Celsius and Fahrenheit Scales
 Exon-Protein Plot
 Technology has changed our lives fundamentally. The connection to each telephone call used to have ...
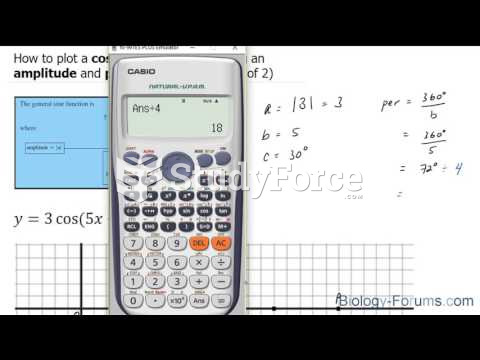 How to plot a cosine function containing an amplitude and phase-shift (Question 1 of 2)
 Calculation of the probabilities in a mating involving the ABO blood type
 Calculation of Joint Probability of a Genotype Based on Seven CODIS STR Markers