This topic contains a solution. Click here to go to the answer
|
|
|

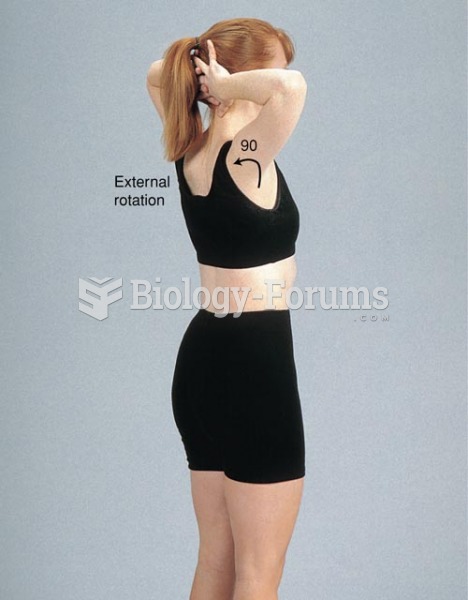 Range of Motion of the Shoulder Joint, External Rotation
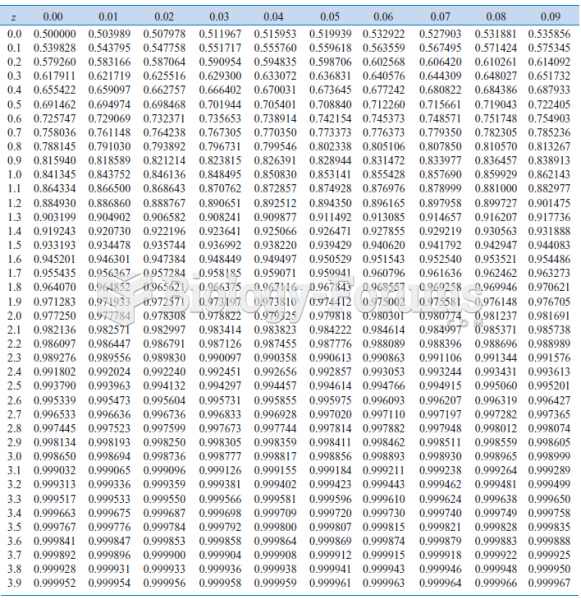 Cumulative Standard Normal Distribution
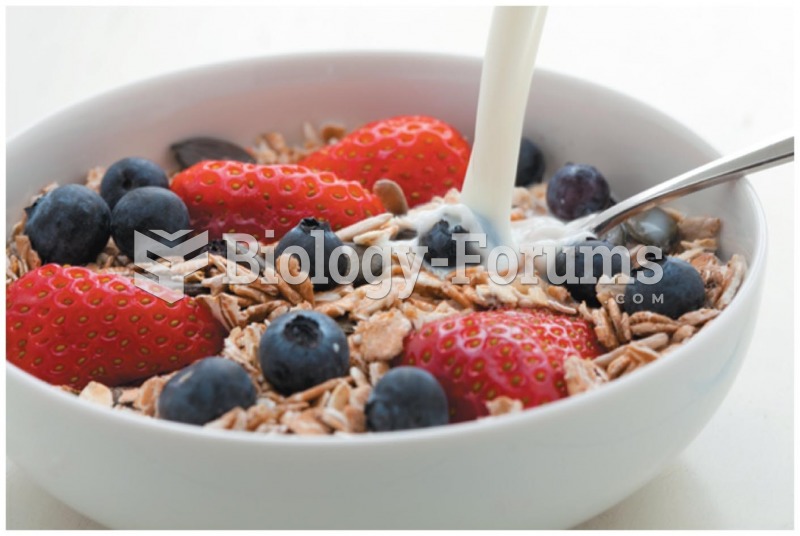 Oatmeal and other whole grain cereals are good sources of carbohydrates to start your morning off
 Standard base-pairing relationships
 calculus homework graph help please
 calculus homework graph help please