This topic contains a solution. Click here to go to the answer
|
|
|

 Standard Medical Record and Types of Reports Found in Record
 potatoes as a very good source of vitamin B6
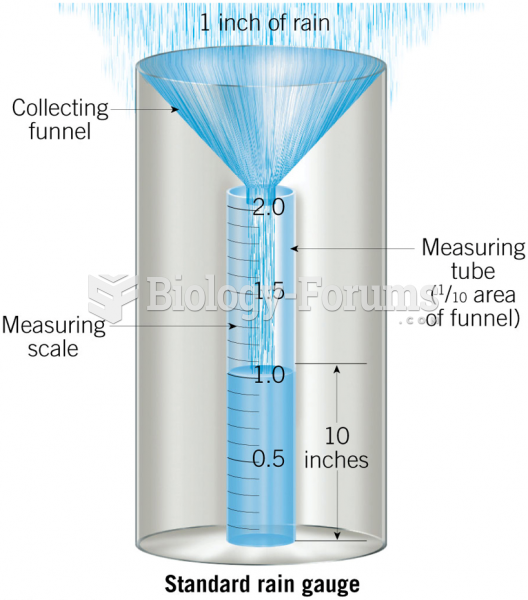 The Standard Rain Gauge
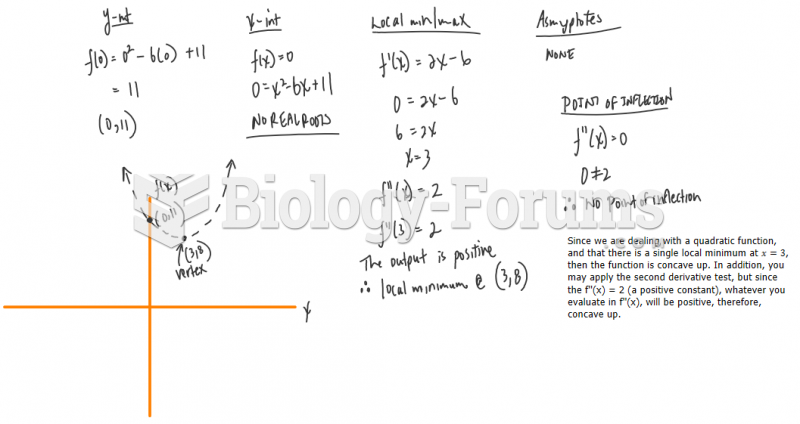 Sketch the graph of the following functions using local maximum/minimums, interc
 General Mathematics - Finding the Range of a Function
 Waiting in line for a photocopier