|
|
|

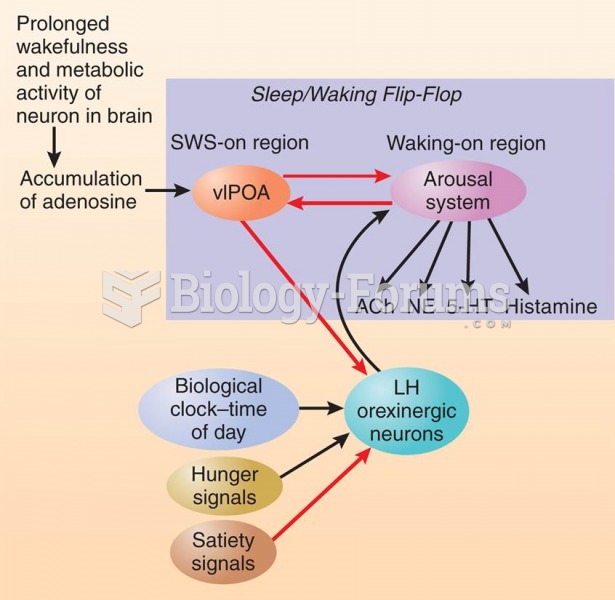 Adenosine, Time of Day, and Hunger
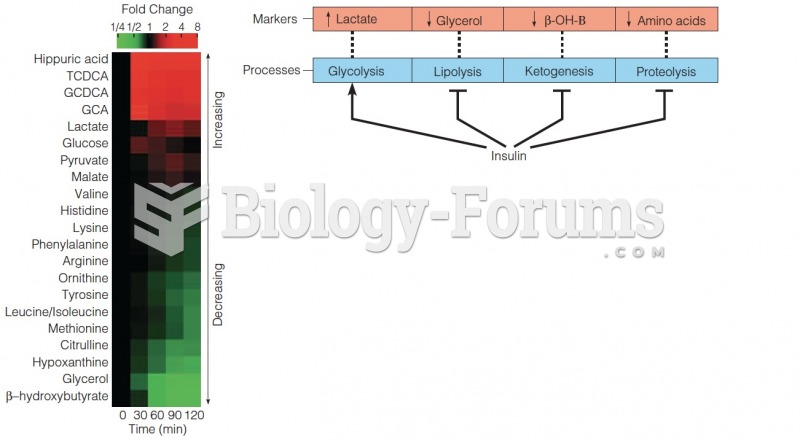 Change in plasma metabolomics following glucose igestion
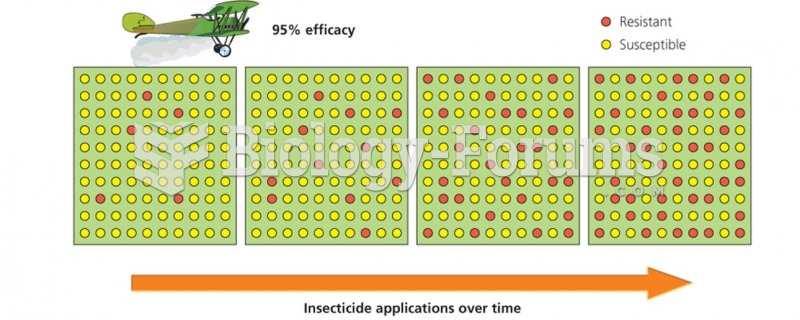 Insecticide application over time
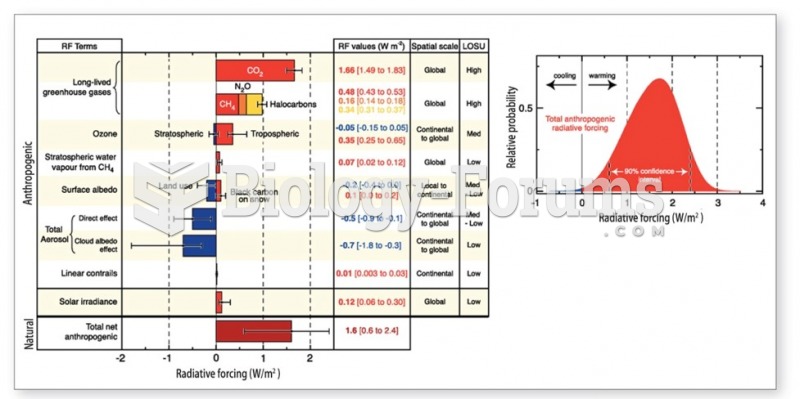 The change in the net of an irradiance, in Wm-2, at the tropopause
 Surprised while reading
 Will the whale Grade 1 Reading