|
|
|

 In 2008, the U.S. economy suffered a gaping wound as several trillion dollars were ripped out of it.
 Barenaked Ladies - Lovers in a Dangerous Time
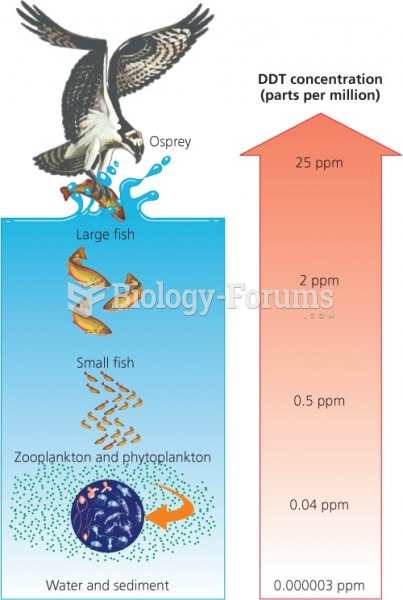 Accumulation of toxicants over time and up the food chain
 Demographic Data for India
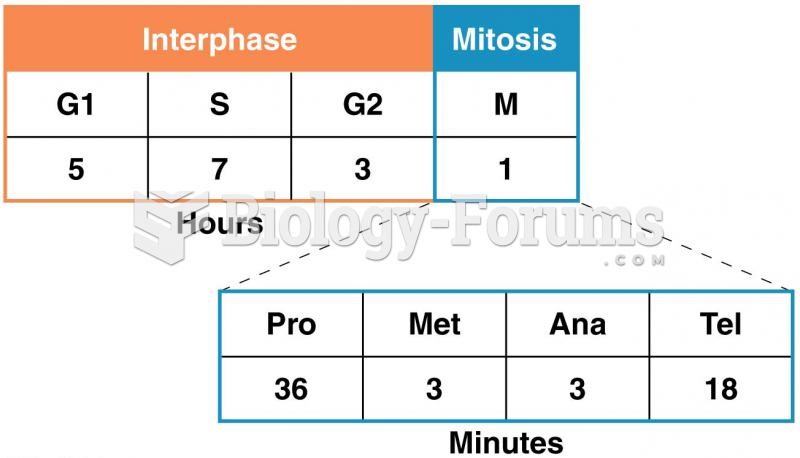 The time spent in each interval of one complete cell cycle of a human cell in culture
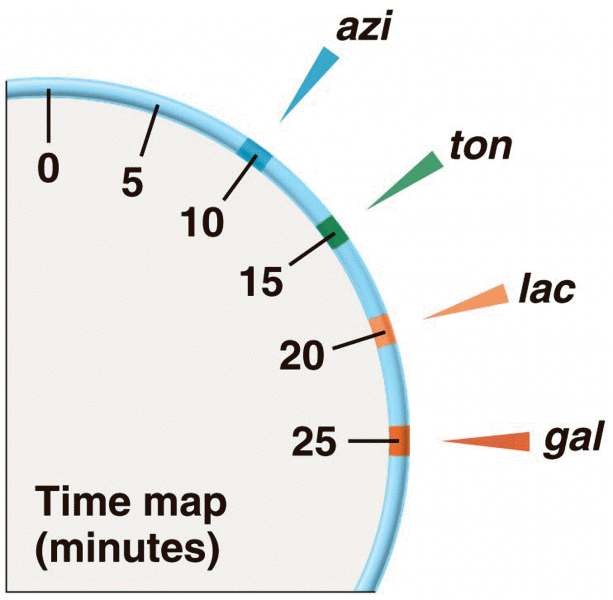 A time map of the genes studied in the experiment