This topic contains a solution. Click here to go to the answer
|
|
|

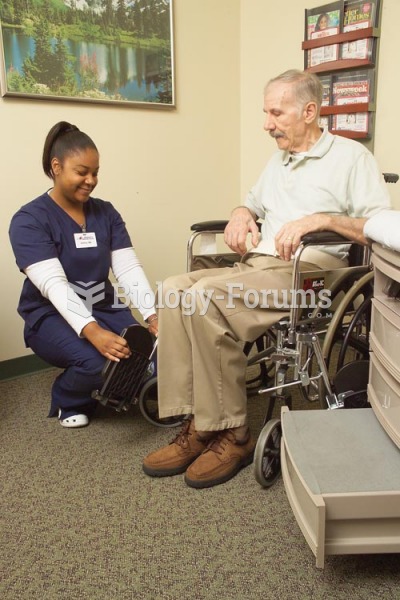 Patients with physical special needs, such as a wheelchair, need to have this documented in their he
 Patients of all socioeconomic backgrounds should be given equal care.
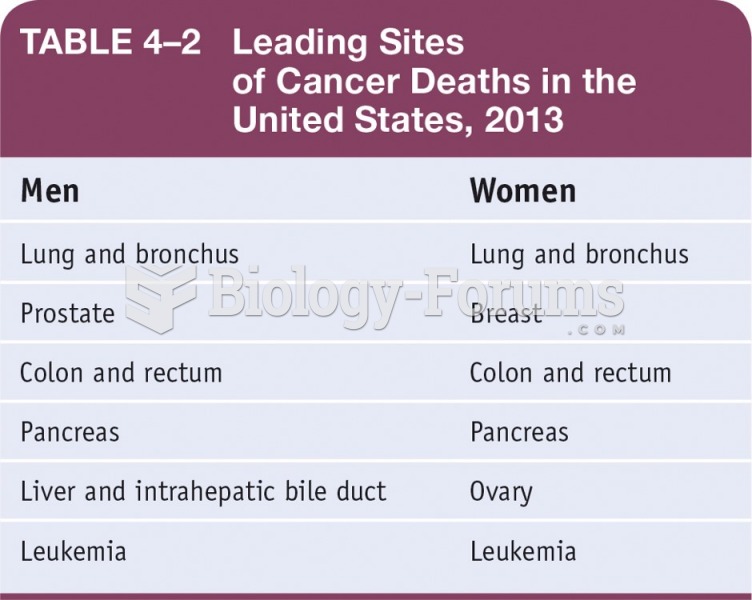 Leading Sites of Cancer Deaths in the United States, 2013
 Neurons in a newborn’s brain
 14 June 2023
 June’s bike shops Grade 1 Reading