|
|
|

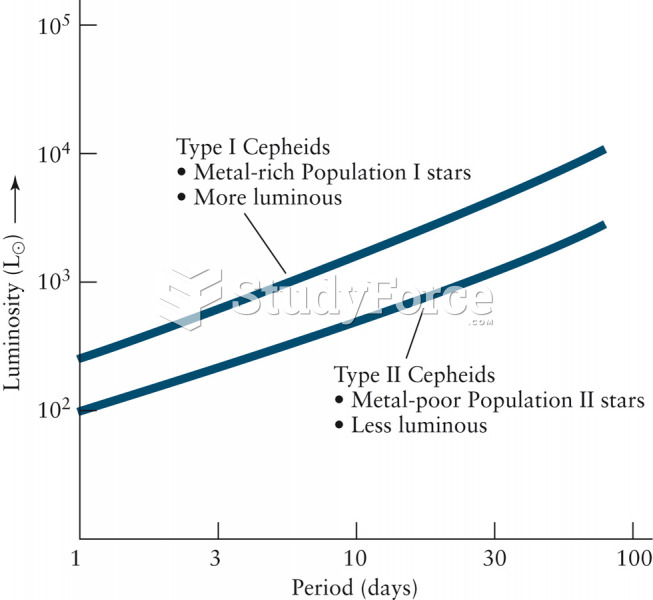 The Period-Luminosity Relation
 Summer Studying
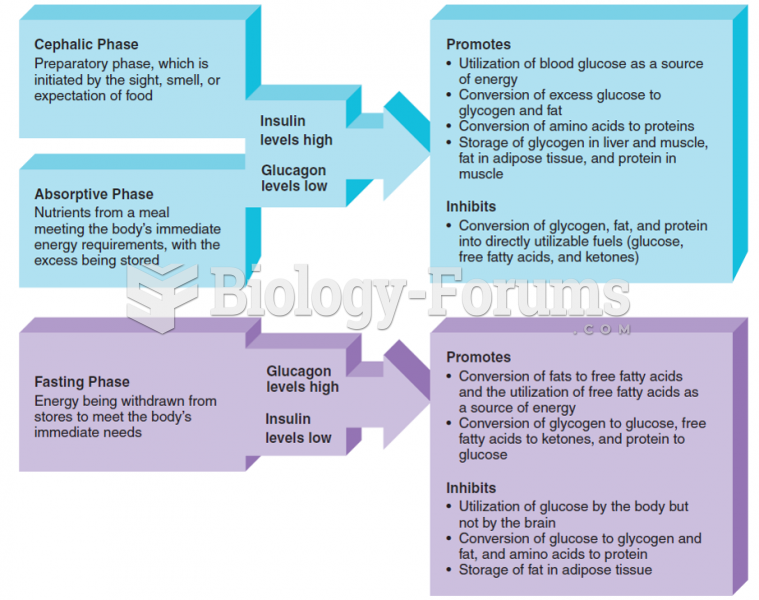 The major events associated with the three phases of energy metabolism: the cephalic, absorptive, ...
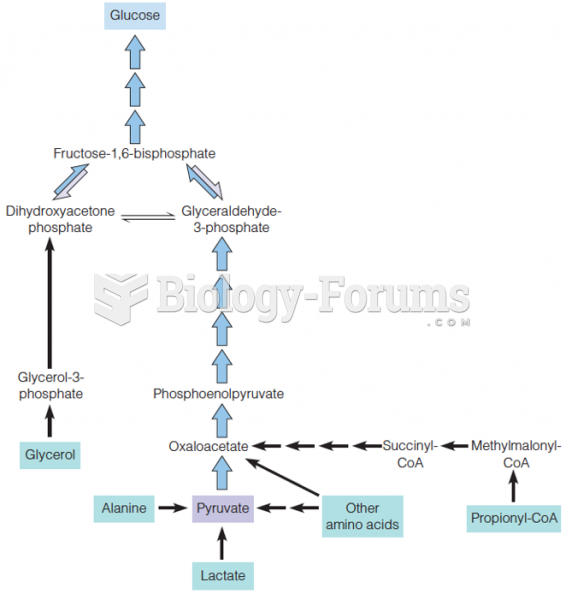 Outline of pathways for glucose synthesis from the major gluconeogenic precursors
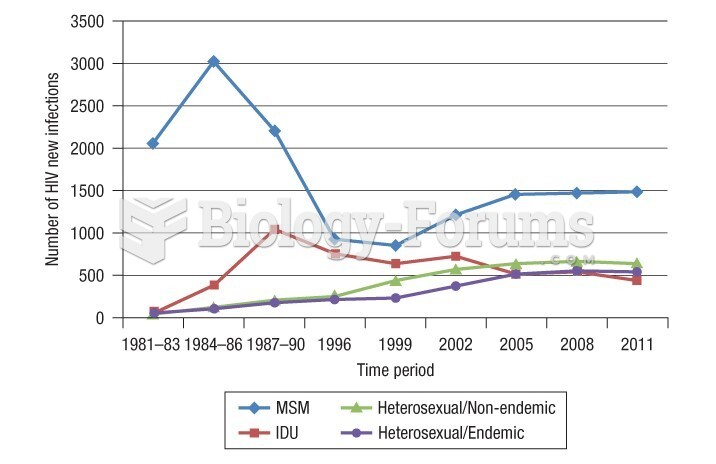 Estimated number of new HIV infections per year over time period in Canada
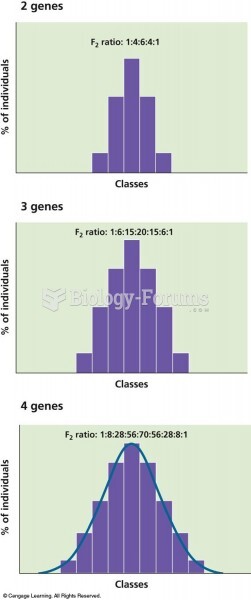 The number of phenotypic classes in the F2 generation increases as the number of genes controlling t