|
|
|

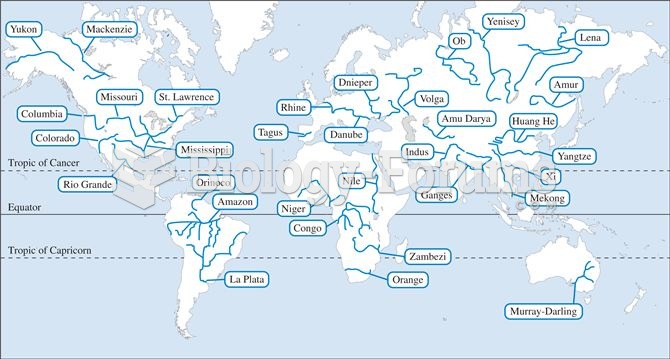 Major rivers throughout the world.
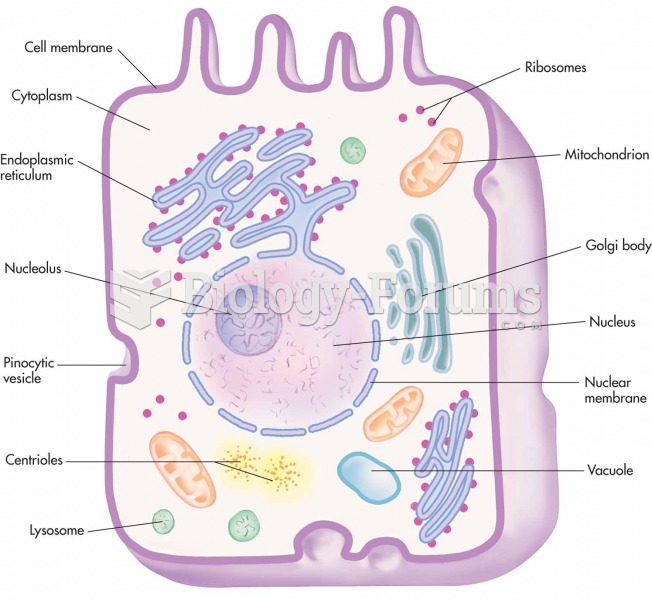 Major parts of a cell.
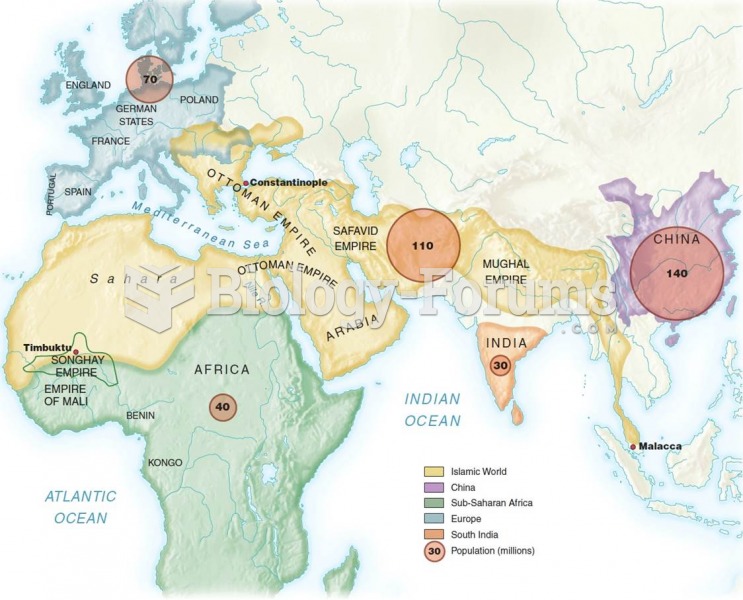 Population of Major Civilizations of Europe, Asia, and Africa, AD 1500
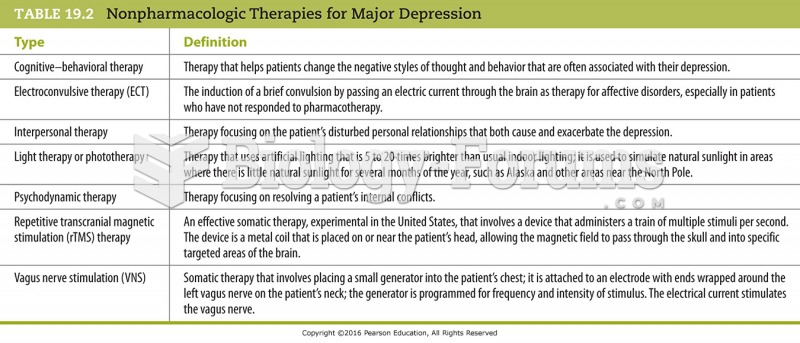 Nonpharmacologic Therapies for Major Depression
 How to create a table of values from an equation and graph
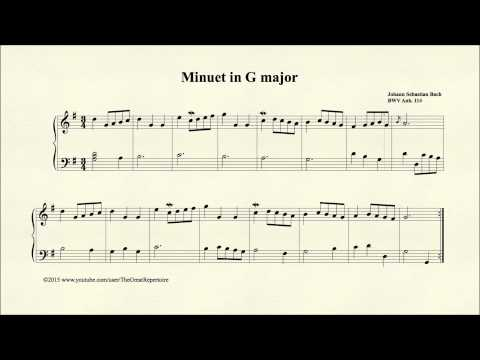 Bach, Minuet in G major, BWV Anh 114, Piano