|
|
|

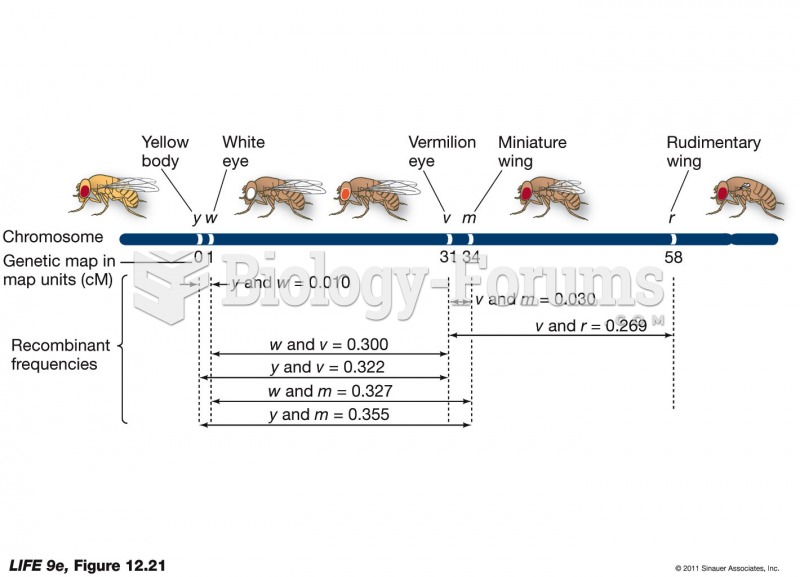 Steps toward a Genetic Map
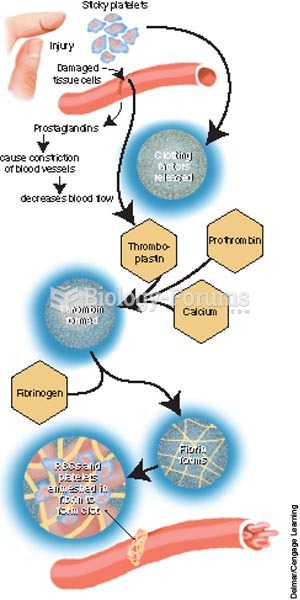 The process of clot formation.
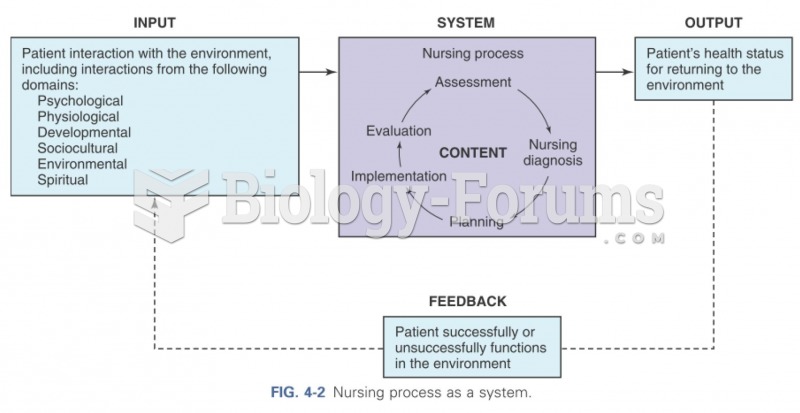 Nursing process as a system
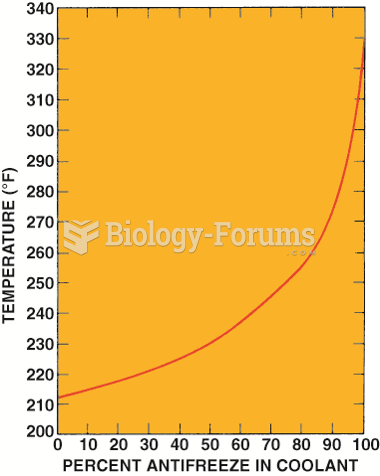 Graph showing how the boiling point of the coolant increases as the percentage of antifreeze in ...
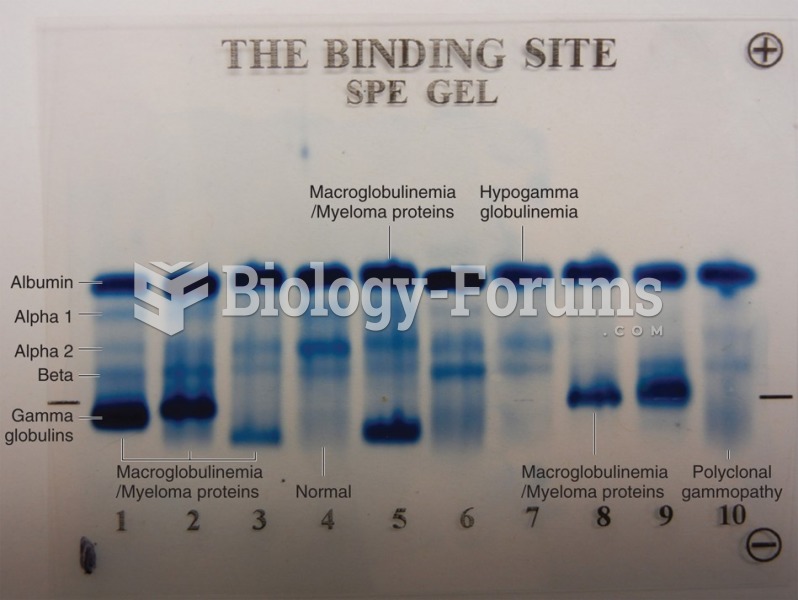 Serum protein electrophoresis gel of 10 sera. Lanes 1, 2, 3, 5, 8, and 9 show evidence of an ...
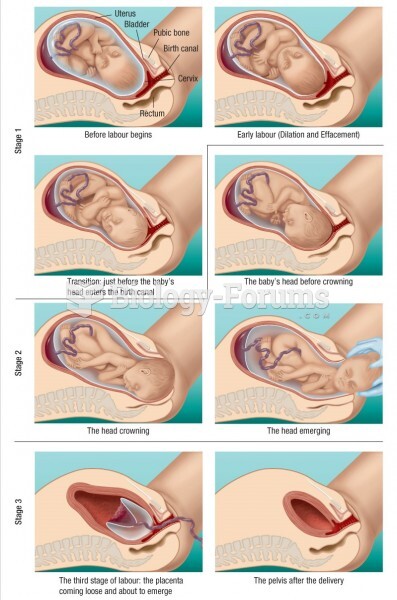 The sequence of steps during delivery is shown clearly in these drawings