This topic contains a solution. Click here to go to the answer
|
|
|

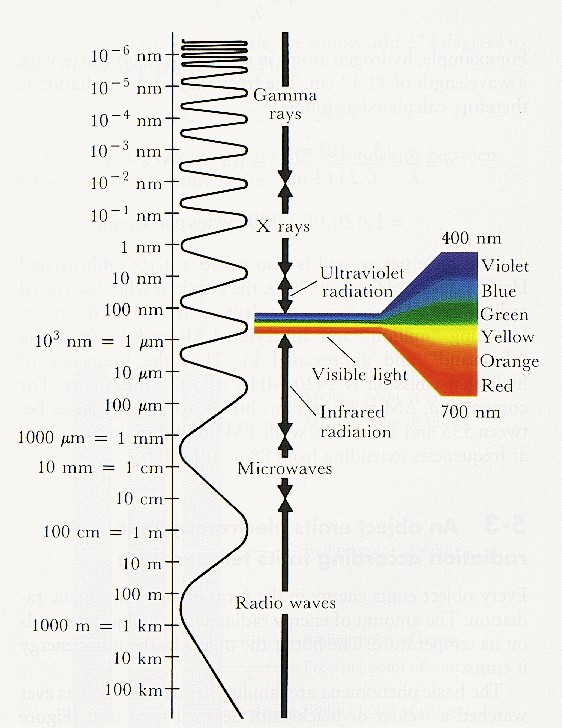 Electromagnetic Radiation Chart
 The Taung Child, the first of the australopithecines to be discovered, is the type specimen for Aust
 Line analysis of Titian, Assumption and Consecration of the Virgin.
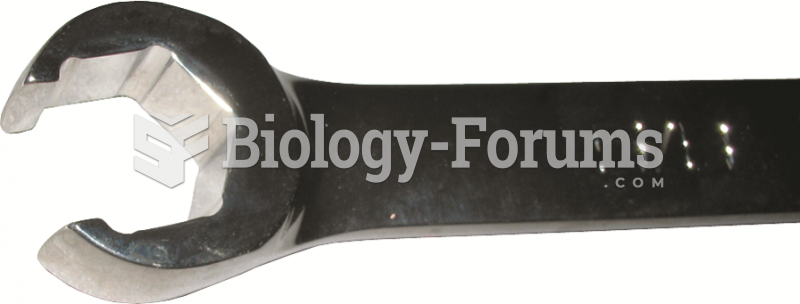 The end of a typical line wrench, which shows that it is capable of grasping most of the head of ...
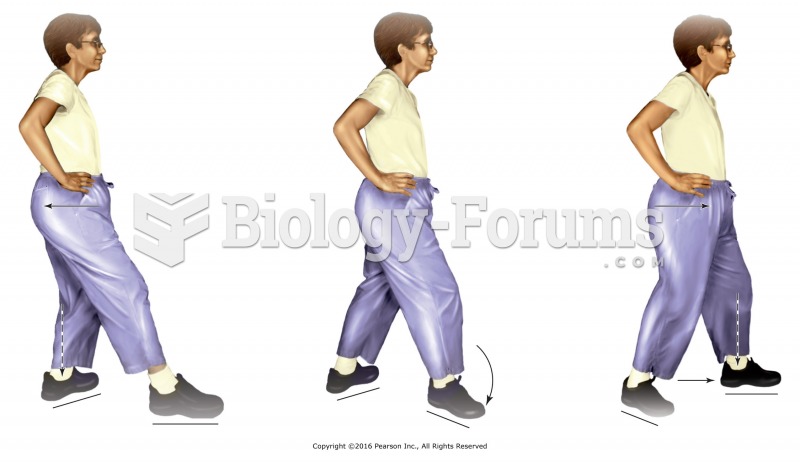 Tai chi walk along straight line. From tai chi stance, shift weight to the back leg and turn the ...
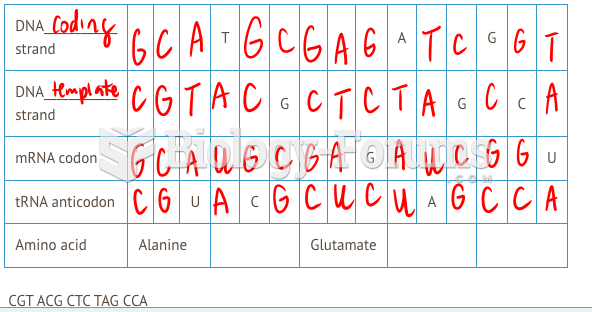 I need help fill up the chart attached phtoto long question